By William Sarsfield
In 2025, the ONS updated its geographical categorisations to ensure they better reflect the UK’s governance and administrative structures. The TPI Productivity Lab recently released a blog covering these changes.
The UK is divided into 182 International Territorial Level 3 (ITL3) subregional areas, which replaced the former Nomenclature of Units for Territorial Statistics (NUTS3) areas created by Eurostat. These ITL3 regions, defined by the Office for National Statistics (ONS), provide a consistent way of subdividing the UK into counties, groups of local authorities, or districts for statistical analysis.
The Productivity Lab’s latest TPI ITL3 scorecard and dashboard series is built on the 2025 boundaries and provides a detailed accessible way of exploring productivity performance across the UK. Through clear and interactive visualisations, users can:
- Compare ITL3 subregional areas within their parent ITL1 region
- Compare ITL1 regional areas against the UK as a whole
- Contextualise the performance of a given region within both local and national frameworks
While our Scorecards and Dashboard series offer interesting features, they do not allow direct comparisons of subregional ITL3 areas belonging to different UK ITL1 areas.
Importantly, not all regions are directly comparable because they differ in key ways, such as their typology (whether they are predominantly rural or urban), their internal structure (industrial composition or population size), or their economic characteristics (sectoral specialisation patterns or workforce composition). To account for these differences, the TPI Productivity Lab’s Subregional Productivity Comparator Tool allows users to select any two UK regions and directly compare their productivity indicators in a meaningful way.
A great example of using the ITL3-area Comparator tool is comparing two regions that collaborate across different parts of the country. Recently, Manchester and Cambridge were awarded £4.8 million in funding from Research England for a groundbreaking cross-UK innovation partnership. This partnership aims to create a nationwide innovation network, leveraging the unique strengths of each region to foster inclusive growth and innovation. The University of Manchester’s Unit M is spearheading this collaboration. They have worked with various partners to establish Atom Valley in Greater Manchester, specifically in Rochdale, in collaboration with Oldham and Bury (the ITL3 region called Greater Manchester North East). This hub serves as a key location for linking research and innovation in advanced materials and manufacturing, supporting subregional, regional and national economic development.
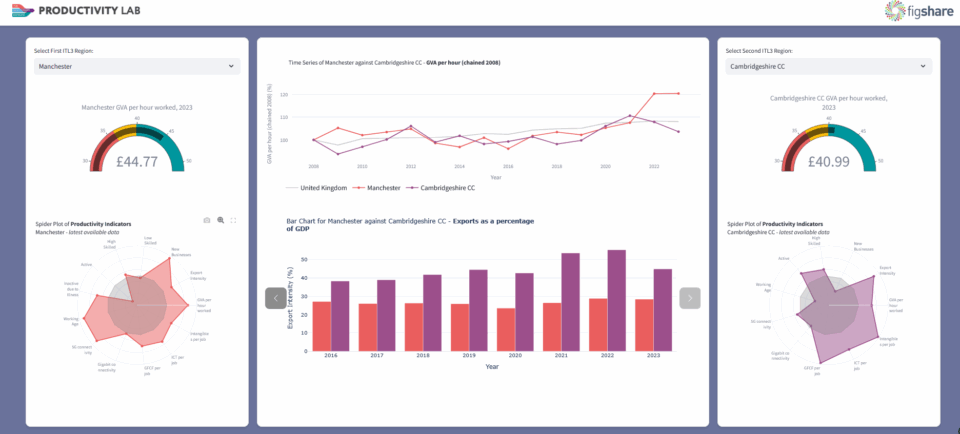
Figure 1: an overview of the dashboard the compare tool creates (Manchester and Cambridgeshire CC)
Each component of the dashboard is designed to showcase a dimension of the productivity data set built for the ITL3 scorecards. The sections on the left and right in Figure 1 show Manchester and Cambridgeshire CC’s 2023 productivity data, respectively, while the section in the middle shows a side-by-side comparison of the productivity time series (in constant 2022 money value).
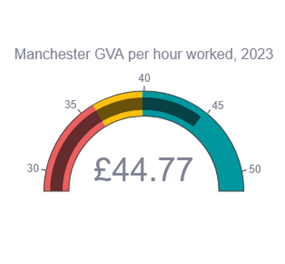
Figure 2a: GVA per hour gauge – Manchester
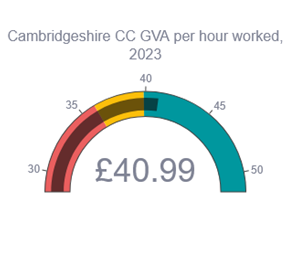
Figure 2b: GVA per hour gauge – Cambridgeshire CC
The gauges in Figure 2a and 2b show the current GVA per hour from the latest ONS regional and subregional labour productivity data release[1]. A traffic light system used in the scorecards has been visualised in the gauge, showing red when less than 95% of the UK median, green when above 105% of the UK median, and yellow 5% within the UK median. This visualisation intends to provide a general comparison of the performance of the region’s labour productivity in the context of all UK regions.
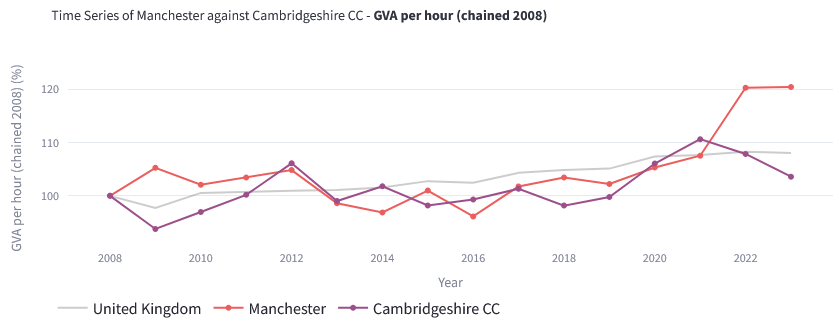
Figure 3: Time series of Manchester against Cambridgeshire CC – GVA per hour (chained 2008 volume, set to 100 in 2008)
Given the current GVA per hour in the gauges, the time series in Figure 3 shows the recent history of the statistics in terms of growth. These growth patterns can then be compared with those of the UK to provide a wider context. In this case, we observe that Manchester has experienced a healthy increase in productivity over the last 4 years, while Cambridgeshire CC has undergone fluctuating productivity over time, staying closer to the UK’s relative growth. To further expand this analysis, we can look at the productivity lab’s regional productivity growth tool. Manchester has experienced a long average annual productivity growth of 1.24%, while Cambridgeshire CC lies below the UK average of 0.51% at 0.24% from 2008 to 2023.
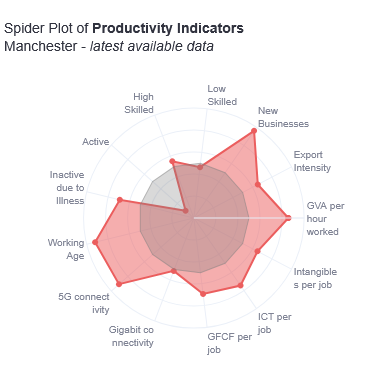
Figure 4a: Spider plot of productivity indicators Manchester – latest data
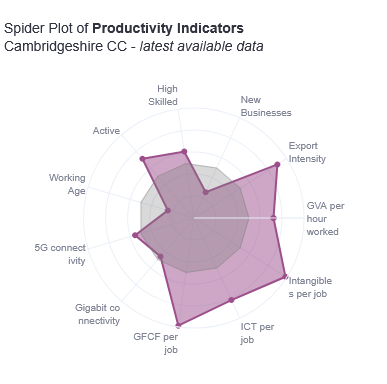
Figure 4b: Spider plot of productivity indicators Cambridgeshire CC – latest data
Figures 4a and 4b show the productivity indicators used in the TPI 2025 scorecard. The most recent available data refers to the years covered in each data release; more information about these indicators can be found in the sources and methods document. All values in the plot have been changed to ranked percentiles and compared against the UK median (50th percentile shown in grey). Hovering over the plots reveals that many of Manchester’s indicators are higher than the UK median with 4 indicators being above the 85th percentile. Cambridgeshire CC’s connectivity indicators are close to the UK median, while new businesses and working age are under performing in the 25th percentile. Export intensity on the other hand is in the 90th percentile, and some of the investment indicators exceptionally high in the 99th percentile. To examine the actual values more closely, we can look at the bar charts in the centre of the tool.
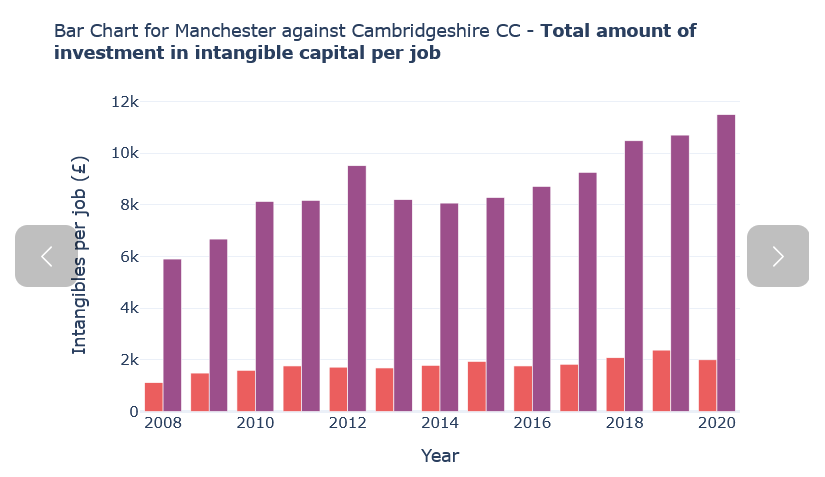
Figure 5: Bar chart for Manchester against Cambridgeshire CC – Intangibles per job
Figure 5 is part of the interactive bar-chart carousel, which automatically cycles through each indicator. Each slide features a clear title and a short description of the indicator. Unlike spider charts that show everything relative to a national average, this visualisation presents the real values of the data (in this case, current prices), providing a direct view of performance. You can also monitor how those values change across the whole available time period, making it easy to spot patterns, shifts, and long-term trends. Here we observe what we couldn’t in the spider charts, the extent to which Cambridgeshire CC outperforms Manchester in intangible investment per job. Intangible assets include software, research and development (R&D), design, branding, firm-specific human capital such as training, and organisational capital[2]. At nearly £11,500, Cambridgeshire CC dwarfs Manchester’s £2,000, which is also above the national average.
With 182 ITL3 regions, over 30,000 different comparisons can be made using the Subregional Productivity Comparator Tool. This tool complements the ITL3 scorecard series and showcases the possibilities of the granular subnational productivity dataset constructed by the TPI Productivity Laboratory.