The Productivity Lab has produced a new series of The Productivity Institute (TPI) UK ITL3 Productivity Scorecards. This edition has further developed the TPI UK ITL1 Productivity Scorecards published in January 2023.
Within the UK, International Territorial Levels (ITLs) are used to compartmentalise regions and areas. ITL1 represents English regions and devolved nations, while ITL3 refers to counties and groups of unitary authorities in England, combinations of council areas and local enterprise companies in Scotland, groups of unitary authorities in Wales, and local government districts in Northern Ireland.
The new ITL3 scorecards allow inter-regional comparisons at the ITL1 and ITL3 levels and intra-regional comparisons within the UK’s devolved nations and regions. They provide the productivity drivers and indicators in 12 ITL1 sub-national areas and 179 ITL3 sub-regional areas for 2019, 2020 and 2021. We have used the latest ONS sub-national productivity data release June 2023 to produce the scorecards which are also available as online dashboards.
TPI UK ITL3 scorecard
| ITL code | ITL1 Region | ITL code | ITL1 Region |
| TLF | East Midlands | TLM | Scotland |
| TLH | East of England | TLJ | South East |
| TLI | London | TLK | South West |
| TLC | North East | TLL | Wales |
| TLD | North West | TLG | West Midlands |
| TLN | Northern Ireland | TLE | Yorkshire and The Humber |
| Sources and methods documentation | |||
| Gouma, Fokke Reitze; Menukhin, Olga; Ortega-Argiles, Raquel (2023). TPI UK ITL3 Scorecards. University of Manchester. Dataset. https://doi.org/10.48420/23791680 (works best in Chrome), CC BY 4.0 | |||

Figure 1. TPI UK ITL3 Productivity Scorecard. London 2021. Click image to view in greater detail.
ITL3 Scorecards as a Tool for Comparative Analysis
Improving productivity in sub-national areas is a complex issue that requires a multidimensional approach. It involves identifying and addressing the key drivers of productivity, such as infrastructure, education, research and development, innovation, and entrepreneurship. To achieve overall performance, it is essential to maintain good performance in most of these drivers. For instance, investing in infrastructure can lead to better connectivity and accessibility, boosting productivity by reducing transportation costs and improving market access. Similarly, investing in education, research, and development can lead to a more skilled workforce and innovative ideas, boosting productivity in the long run. Therefore, a comprehensive strategy that addresses all the key drivers of productivity is crucial for improving performance in sub-national areas. An example ITL1 London area is shown in Figure 1.
The new ITL3 scorecards include the Productivity category. This category shows three metrics showing the relative performance of labour productivity across the ITL3 regions, Taxonomy relative to the UK, Taxonomy relative to ITL1, and GVA per hour worked. The taxonomy classifications of the ITL3 sub-regions are based on productivity level (GVA per hour worked) and productivity change over years (from 2008 to the reporting year) relative to the UK average or the parent ITL1 average respectively. A full explanation for taxonomies is available in the Sources and Methods document.
In the example of ITL1 London for 2021, London was categorised as a Losing Ground region when compared to the UK, as their regional productivity performance was higher, but its productivity growth was lower than the UK average.
Similarly, all ITL3 sub-regions in the ITL1 London area are compared against the UK average in Taxonomy relative to the UK, and against ITL1 London performance in Taxonomy relative to ITL1 rows. For example, TLI72 Brent is Steaming Ahead relative to the UK average but Catching Uup relative to ITL1 London average (although its GVA per hour being £44.91 is lower than £51.08 for ITL1 London, Brent’s productivity growth from 2008 to 2021 was higher than that of ITL1 London (underlying values are not shown).
When the ITL3 sub-regions are compared within the ITL1 area, as in London in this example, the distribution of the local productivity performances in terms of productivity output and growth varies notably across the four taxonomy categories (Steaming Ahead, Losing Ground, Catching Up and Falling Behind), and intra-regional variations in productivity drivers might help to explain the variation in productivity output or growth at a higher regional level.
A comparative analysis of the drivers and indicators can inform national, regional, and local strategic initiatives and objectives. The UK nation, regions, devolved nations, and localities can assess their relative strengths and weaknesses vis-à-vis other geographies across the UK and within their region. An indication of poor performance may expose a regional bottleneck that needs to be addressed to improve their productivity performance and, therefore, may suggest a policy area for further exploration.
There will be ITL1 regions that may underperform in some indicators, and the explanation could be found in the uneven performance of their ITL3 areas, with only a few of them being responsible for the poor (ITL1) regional performance. The opposite can also be seen. For instance, London and the South East are areas that outperform in many of the scorecard indicators, but this outperformance may eventually hide the severe underperformance of some of their ITL3 areas.
Main Productivity Drivers and Metrics
The structure of TPI UK ITL3 Productivity Scorecards has been modified from the ITL1 Scorecards. This ITL3 series covers five key regional productivity drivers: Business Performance, Skills, Health & Wellbeing, and Investment, Infrastructure & Connectivity. These drivers are evaluated using 15 indicators. Figure 2 shows the structure and the driver categories focus on the following:
- Productivity performance: the scorecards incorporate information on the ITL3 GVA per hour worked as well as the regional taxonomies concerning the whole UK (inter-regional variation) or their own ITL1 (intra-regional variation).
- Business performance and characteristics are captured by showing the Export Intensity and the New Business creation.
- Regional Skills are measured by the % of Low Skilled and High Skilled educated in the workforce.
- Regional Health and Wellbeing are captured using the Active working population, the Inactive due to illness and the regional average Working age.
- Investment, infrastructure and connectivity are illustrated by the regional 4G connectivity, Fibre connectivity, Gross Fixed Capital Formation per job, ICT per job and Intangibles per job.
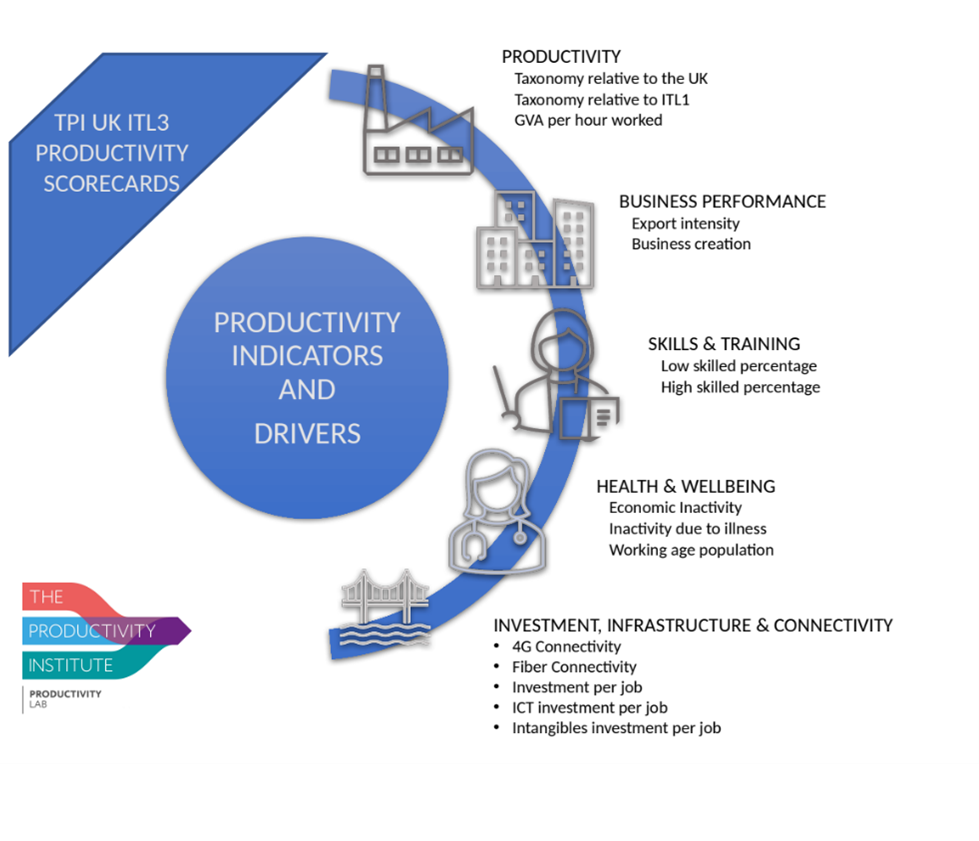
Figure 2. Structure of the TPI UK ITL3 Scorecards
More details on the description and sources of data for all the indicators in the new series can be found here.
Creating the TPI UK ITL3 Scorecard series
The previous series of UK regional productivity scorecards covered the ITL1 level. However, due to the increasing interest in understanding the main drivers of inter-regional and intra-regional variations, several TPI stakeholders requested a new version of the data with higher geographical granularity. In response, using various sub-national data sources, the Productivity Lab reviewed the suitability of the ITL1 productivity drivers for ITL3 geographies.
The creation of this new scorecard series benefitted from a series of consultations with different stakeholders, members of the TPI’s Productivity Forums, and the TPI Productivity Lab’s expert group. Figure 3 illustrates the evolution in the creation of the TPI UK ITL3 Productivity Scorecard series.
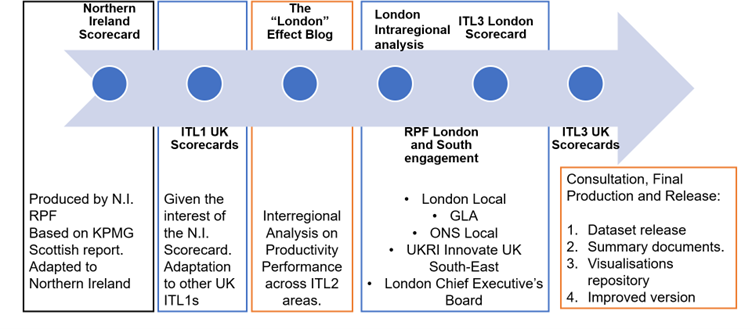
Figure 3. The creation of the TPI UK ITL3 Productivity Scorecard Series
We have incorporated insights and advice from a RPF survey and the consultations into the composition of the scorecards. Although different specific drivers might be of utmost importance and preference to drive productivity in certain geographic areas, all the indicators within the main productivity driver categories comprising the TPI Lab scorecards were deemed to be useful for policy development by our stakeholders. Certain indicators such as environmental and transport measures that were considered to be useful, but not covered by the TPI ITL3 Scorecards, would be difficult to obtain in a consistent manner for all ITL3 sub-regions. However, based on the feedback, the TPI Lab team has been working to collect additional indicators and metrics to expand the main productivity driver categories and improve the overall usefulness of the scorecards for our audience.
Acknowledgment
We acknowledge the expert advice and suggestions received from several members of our Productivity Forums and the TPI Productivity Lab Expert Group members.
Note
The TPI Productivity Scorecards were inspired by the work of David Jordan and John Turner from the TPI Northern Ireland Productivity Forum who produced The Northern Ireland Scorecard published by TPI in 2022 and were adapted from the 2021 CBI/KPMG report. The TPI’s UK ITL1 and ITL3 Scorecards have been methodologically modified from the previously produced and published work referenced above.
Dataset created by Reitze Gouma, Olga Menukhin and Raquel Ortega-Argilés
Blog written by Raquel Ortega-Argilés and Olga Menukhin