The Productivity Lab aims to produce data-related tools and metrics to help researchers measure productivity. However, productivity is hard to measure, and its drivers are numerous and strongly interrelated. The Productivity Lab has developed the TPI UK ITL1 Scorecard series to compare productivity performance across UK regions and devolved nations.
TPI Scorecards for UK regions and devolved nations
(March 2023 version)
| ITL code | ITL1 Region | ITL code | ITL1 Region |
| TLF | East Midlands | TLM | Scotland |
| TLH | East of England | TLJ | South East |
| TLI | London | TLK | South West |
| TLC | North East | TLL | Wales |
| TLD | North West | TLG | West Midlands |
| TLN | Northern Ireland | TLE | Yorkshire and The Humber |
| ITL1 Scorecards Overview | TPI Scorecard Annex | ||
| Cite as Menukhin, O.; Gouma, F.R.; Ortega-Argiles, R. (2023), TPI UK ITL1 Scorecards, TPI Productivity Lab, The Productivity Institute, University of Manchester. DOI: 10.48420/21931770 CC BY 4.0 |
|||
Several approaches involving sophisticated econometric and statistical techniques can be used to compare productivity performance at the sub-national level. The use of scorecards can be seen as the second-best alternative to a thorough scientific analysis. It constitutes a valuable performance metric used to identify the main productivity regional drivers and bottlenecks and how they are precisely related.
Scorecards are performance metrics used to identify regional characteristics and improve their resulting external productivity outcomes. They can be used to measure and provide feedback to organisations such as regional stakeholders to make better decisions to improve productivity in the short and long run.
The main advantages of scorecards over other performance metrics are that they can be easily compared and updated over time and that they allow one to pool together information and data into a single report rather than having to deal with multiple tools. The research design and the data collection process in the scorecards are crucial to ensure good comparability among the regional performance drivers and productivity outcomes.
TPI Regional Productivity Scorecard Drivers and their metrics
The TPI UK ITL1 Productivity Scorecards, based on CBI/KPMG (2021) and inspired by Jordan and Turner (2022)i, are comprised of five main regional productivity drivers that need to be analysed: business performance, skills and training, policy and institutions, health and wellbeing, investment and infrastructures. These five regional productivity drivers are captured using 17 indicators, and their past performance is analysed in the short and long-term to help develop regional strategic initiatives and objectives.
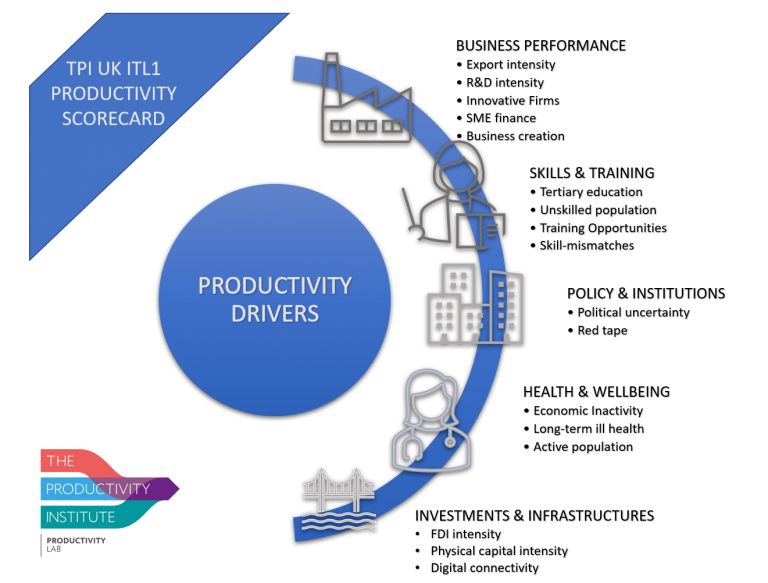
- Business Performance is analysed through export intensity (exports as % of GDP), R&D intensity (R&D per job) and innovative businesses (Innovation active businesses), SME finance (% of SMEs where finance is a major obstacle) and business creation (Business births as % of all active enterprises).
- Skills and Training at the regional level includes information on tertiary education (% of the population with tertiary education, NVQ4+), unskilled population (% of the population with no or low skills, NVQ1 or lower), training opportunities (% of employers providing training in the past 12 months), and regional skill mismatches (% of vacancies which are skill shortage vacancies).
- Policy and Institutions are evaluated by including measures on political uncertainty (% of SMEs where political uncertainty and government policy is a major obstacle) and red tape (% of SMEs where legislation & regulation is a major obstacle).
- Health and Wellbeing are described with measures of economic inactivity (economic inactivity rate), long-term ill health (% of economic inactivity due to long-term ill health), and active population (% of the population aged 16-64).
- Investment and Infrastructure are evaluated by including data on Foreign Direct Investment intensity (FDI per job), regional infrastructure intensity (Gross fixed capital formation per job) and measures of regional connectivity (access to Gigabit-capable internet services).
TPI Regional Productivity Scorecard methodology
The TPI UK ITL1 Productivity Scorecards reports for each metric the median for the UK (with half of the observations above and half below). For each of the 8 English regions (ITL1) and three devolved nations, we show whether their measure is below 95% (red), above 105 % (green) or between 95 and 105% of the UK’s national median (orange).
Main regional productivity findings
Disparities between regional productivity performance are significant both across and within UK ITL1 regions. London remains the most productive part of the country in absolute terms, while Northern Ireland appears as the lowest productivity performer. However, the picture is not clear cut, with most regions having areas that are doing well and some that could be performing better.
Ranking the regions
Ranking the regions, according to the level of productivity, with London being the highest and Northern Ireland the lowest, we find a reasonably strong but far from homogenous alignment with the indicators:
- For the regions with the highest level of productivity (London and the South East), we find that more than half of the 17 indicators colour green.
- London is notably weak on three of the 5 business performance measures related to R&D, innovation intensity and finance for SMEs. It also scores poorly on policy obstacles.
- The South East notably underperforms on new business creation and vacancies of skilled workers.
- Scotland, East of England, the Southwest and the West Midlands all score green on 6 or 7 of the 17 indicators.
- Scotland does particularly well on all four skills and training indicators.
- East of England scores well on 3 of the 5 business performance indicators (R&D, innovation intensity and finance for SMEs) – interestingly, exactly those indicators for which London is weak.
- The West Midlands also scores well on R&D and innovation intensity and FDI and digital connectivity.
- The South West scores well on 2 of the 5 business performance indicators (R&D and finance for SMEs), 2 of the 4 skills indicators (a high % in tertiary education and a low % in low or no skills) and low inactivity rates.
- East Midlands, the Northeast and Northern Ireland score strongly on 4 indicators.
- Like the West Midlands, the East Midlands also scores well on R&D and policy indicators. It also does well on low economic activity. But, in contrast, the West-Midlands, is average on FDI and connectivity.
- The North East scores exceptionally well on exports, new businesses, business training and few skill-related vacancies.
- Northern Ireland, while the weakest in productivity levels, scores relatively well on R&D, tertiary education levels, few skill shortages and good digital connectivity. However, Northern Ireland is weak across most other indicators, notably in business performance, policy and well-being.
- The Northwest, Yorkshire and the Humber, and Wales all score above the UK median for only 1 or 2 of the 17 indicators.
- North West, while scoring relatively high on productivity levels (5th of the 11 areas), does comparatively well for only new business creation and limited legislative and regulatory obstacles but is weak on other business performance indicators, health and well-being, and investment.
- Yorkshire and the Humber show strength in innovation intensity and few legislative and regulatory policy obstacles but are weak on exports, R&D and FDI.
- Wales outperforms the UK average only for exports but shows broad-based weakness in well-being, investment, infrastructure, and digital connectivity.
Ranking the indicators
Looking at individual indicators, we find that the distribution across regions varies quite a lot:
- On business performance indicators, the performance of regions is widely spread. Only three areas outperformed the UK median on two of the five indicators: innovation intensity (East of England, West Midlands and Yorkshire & the Humber) and finance for SMEs (South East, East of England and South West).
- On skills & training, only three regions outperformed the UK average for business training (London, Scotland and Northeast) and skill shortages (Scotland, North East and Northern Ireland).
- On policy and institutions, the spread of indicators is reasonably comprehensive.
- In contrast, the distribution of health and well-being is more skewed, showing a clear north-south divide.
- On the proportion of the working-age population, only London is significantly above the UK median, with all other regions and devolved nations hovering around it.
- There is a high skewness for long-term ill health, where only London, South East and East of England outperform the UK median.
- On investment, infrastructure and connectivity:
- On FDI, only London, the Southeast, Scotland and the West Midlands are above the UK median.
- Only London, the South East and East of England outperform the UK median on investment.
- On digital connectivity, London, the West Midlands and Northern Ireland are above the UK median, while the productivity levels of those three areas are very different.
How to use the indicators?
The use of those indicators is helpful to English regions and devolved nations to assess their relative strength and weaknesses vis-à-vis others and help them understand which policy areas might deserve further investigation to improve performance.
Each region can only do well on some indicators. There is no silver bullet to improve productivity. But broadly speaking, a larger group of indicators performing well above the UK median across the five main regional productivity domains points to a better productivity performance.
Acknowledgement
We acknowledge the expert advice and suggestions received from John Turner, leader of the TPI Northern Ireland Productivity Forum, and David Jordan, member of the TPI Northern Ireland Productivity Forum from Queen’s University Belfast
Note:
iThe TPI UK ITL1 Scorecards are adapted and methodologically modified from Jordan and Turner’s The Northern Ireland Productivity Dashboard 2022 which was inspired by the CBI/KPMG Scottish productivity Index 2021.
Dataset created by Olga Menukhin, Reitze Gouma, and Raquel Ortega-Argilés
Blog written by Raquel Ortega-Argilés and Bart van Ark