Productivity Measurement Analysis series – United States, Q4 2023 by Martin Fleming. This builds on from his initial blog from 2 February, 2024.
General Summary and Main Figures
U.S. nonfarm business sector labour productivity increased 3.2% in the fourth quarter of 2023, the U.S. Bureau of Labor Statistics (BLS) reported on March 7th. The report reflected revised data for both 2023’s fourth and third quarters based on more recent source data than were available for the February 1 report.
In addition, the release also included the annual benchmark revision of employment and hours of employees on nonfarm business sector payrolls as well as payrolls in other business sectors. For the nonfarm business sector, the Q4 labour productivity estimate was unrevised at 3.2%.
Nonfarm business sector output increased 3.5% and hours worked increased 0.3%, both quarter-over-quarter (QoQ) at a seasonally adjusted annual rate (SAAR). From the same quarter a year ago, nonfarm business sector labour productivity increased 2.6%.
Unit labour costs in the nonfarm business sector rose at a 0.4% annual in the fourth quarter, reflecting a 3.6% increase in hourly compensation and a 3.2% increase in productivity. Unit labour costs increased 2.5% over the last four quarters.
For the year 2023, nonfarm business sector productivity rose 1.3%, a reversal from a 1.9% decline in 2022. Unit labour cost rose 3.0%, nearly three percentage points slower than the 5.7% 2022 increase.
| Sector | Quarter-on-year ago comparison, SAAR (Q4, 2022) |
Quarter-on-quarter comparison, (Q3, 2023) |
Pre-COVID-19 comparison, SAAR (Q4, 2019) |
| Nonfarm Business | |||
| Labour Productivity | 2.6% | 3.2% | 1.6% |
| Unit Labour Cost | 2.5% | 0.4% | 3.7% |
| Manufacturing | |||
| Labour Productivity | 0.5% | 1.3% | 0.3% |
| Unit Labour Cost | 6.1% | 5.3% | 4.4% |
| Nonfinancial Corporate | |||
| Labour Productivity* | 1.4% | 3.3% | 1.7% |
| Unit Labour Cost* | 3.3% | 1.6% | 3.8% |
*Q3 2023 most recent data. Comparison with Q3 2002, Q2 2023, and Q42019.
Manufacturing sector labour productivity rose 1.3% in the fourth quarter of 2023, as output decreased 2.0 percent and hours worked declined 3.3 percent, all QoQ at SAAR. Unit labour costs in the manufacturing sector increased 5.3%, reflecting a 6.7% increase in hourly compensation and a 1.3% increase in productivity, all QoQ at SAAR. Manufacturing unit labour costs increased 5.9% from the same quarter a year ago.
The annual benchmark revisions reduced the estimate of Q4 manufacturing sector labour productivity growth by 1.0 percent point with output decreasing 0.4 percentage points less than the prior estimate and hours worked falling 1.3 percentage points less than the prior estimate.
For the year 2023, manufacturing sector productivity declined 0.8%, a slightly slower pace than the 1.2% 2022 decline. Unit labour cost rose 5.9%, more than one percentage point faster than the 4.8% 2022 increase.
Revised third-quarter 2023 measures for the nonfinancial corporate sector were also published in the March 7th release. Productivity increased a revised 3.2% in the third quarter as output and hours worked increased 3.9% and 0.7%, respectively, all QoQ at SAAR. Productivity increased 1.4% from a year earlier.
In contrast to revisions to the manufacturing sector, the annual benchmark revisions increased the estimate of Q3 nonfinancial corporate labour productivity growth by 0.7 percent point with output increasing 0.6 percentage points less than the prior estimate and hours worked decreasing 0.1 percentage points less than the prior estimate.
Insights into the Q4 2023 Productivity Release
In addition to the annual benchmark revision of employment and hours, the March 7 Productivity and Cost release from the BLS incorporates revised third quarter, fourth quarter, and annual average data for 2023. The revisions incorporate regular updates of source data on output and compensation published by the Department of Commerce on February 28, 2024. Quarterly measures of real hourly compensation in 2023 were revised to reflect updates to seasonally adjusted data from the BLS Consumer Price Index program released on February 13, 2024.
Strong fourth quarter US nonfarm business sector productivity growth is the fourth consecutive quarter of strong productivity growth with five of the six prior quarters – back to Q4 2022 – growing at a greater than 2.0% annual rate. Strong output growth and a limited 0.6% year-over-year increase in hours worked reflects the maturity of the current business cycle.
In the fourth quarter, manufacturing sector productivity growth continued at a disappointing rate. The revised estimate lowered productivity growth by 1.0 percentage point. Quarterly volatility has been persistent in the post-pandemic period. However, the manufacturing sector’s long-term productivity decline continues with the level now six percent below its first quarter 2011 peak.
Discussion
Strong 2023 nonfarm business sector labour productivity reflects strong output growth with limited increases in hours worked. With the productivity recovery in its early days whether the underlying factors are business cycle related, early signs of a long-term technology-driven trend, or a combination of both remains unclear. Whatever the origins of the nonfarm business sector productivity growth revival, manufacturing sector productivity remains challenging.
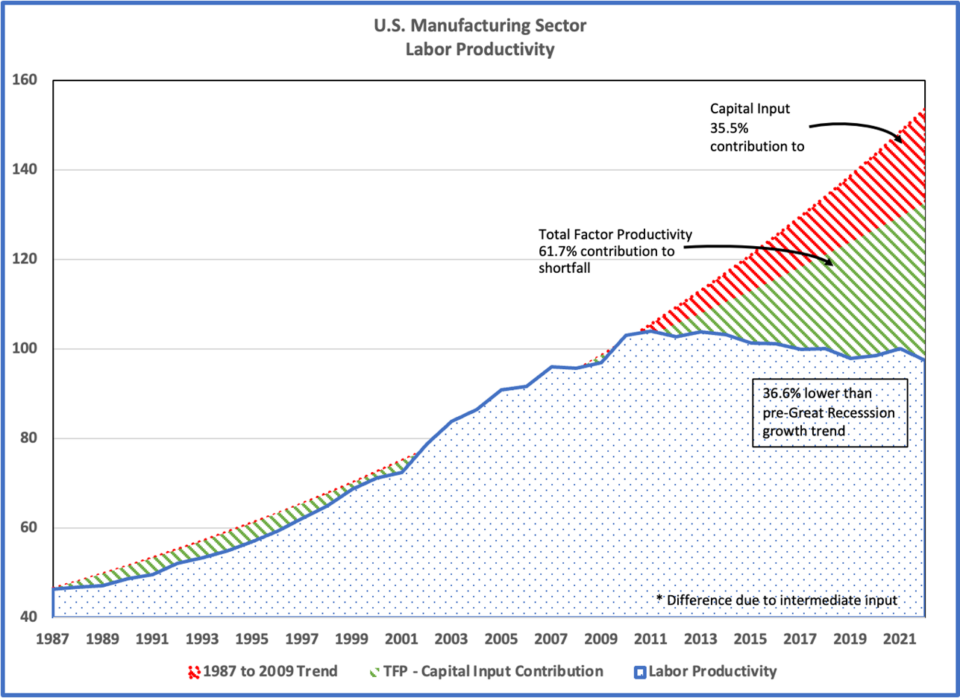
The figure below shows that the level of manufacturing sector labour productivity has declined by six percent since 2011. The figure shows the 36.6% gap that has emerged between the pre-2011 trend and the post-2011 actual performance. With the benefit of the BLS Total Factor Productivity data set, the gap can be parsed between the TFP decline and the growth slowdown in capital investment. The TFP decline accounts for approximately 60% of the productivity gap and slower capital investment growth accounts for one third of the gap. Labour input over the post-2011 period has remained on trend with capital intensity growth slowing.
The aftermath of the Great Recession and financial crisis appears to have resulted in a period of reduced innovation and lagging tangible and intangible capital investment in the US manufacturing sector. The cause or causes of the gap and its possible reflection of an innovation decline and a capital investment slowdown remain open to speculation. Capital investment tax incentives remained favourable over the period and with the 2017 Tax Cuts and Jobs Act, tax incentives became more favourable.
The impact of trade and technology are often cited as the most likely candidates. In fact, low-cost high-quality Chinese competitors continued to gain market share over the period. The period was also one bookended by old and new technologies. The Third Industrial Revolution technology was well beyond maturity, the 1990s and 2000s IT/Robotics technology was likewise deeply penetrated, and cloud computing based artificial intelligence had yet to reach scale.
In a similar vein, John Van Reenen and collaborators describe a comparable trend across the U.K. economy – not limited to the manufacturing sector. See here and here.
Nicholas Bloom, Mirko Draca, and Van Reenen observe that reduced import barriers – as when China joined the World Trade Organization – increases competitive intensity, benefiting innovation. Conversely, they point to fundamental Schumpeterian forces in which competition lowers price-cost margins, reducing innovation incentive. So, the effect of competition on innovation incentives is inherently ambiguous. In addition, Bloom, Draca, and Van Reenen cite the consensus among most economists that trade has been less important than technology in explaining inequality trends, which are, in part, a consequence of manufacturing sector disruption.
Much remains to be learned.