By Josh Martin and Michael Becker
Background
In May 2021, ONS published a new experimental dataset of estimates of capital investment by UK regions as part of their Subnational Development program. This dataset featured a breakdown of investment into five high-level asset groupings, 19 industries (section-level of SIC 2007), and over 200 regions (ITL1-3). This was the first regional capital investment dataset to feature an asset breakdown and it expanded the industry and regional breakdowns as compared to previous datasets from the ONS.
In our recent Insights Paper for The Productivity Institute, we documented and analysed this new dataset. As part of that paper, we wanted to compare the growth rates of investment across different regions over time. This was not possible directly from the ONS dataset since that contained investment estimates only in “current prices” (nominal terms) – that is, prices from the period in which the investment took place. As such, investment in 1999 might appear to be less than investment in 2019, largely because prices had risen in the intervening two decades. What we really care about is whether, after adjusting for inflation, investment in “real terms” had also increased.
To make such a calculation, one needs a measure of price changes – a “price index” or “deflator”. These measure price trends over time and can be used to adjust data in current prices into “constant prices” by deducting the effect of price changes. This is most easily done by dividing the current price estimates by the price index (which is usually set equal to 100 in a given year).
A price index should capture, as well as possible, price trends of the thing(s) it is designed to be used for. This sounds obvious, but it means we should not use something like the CPI to deflate capital investment – the CPI reflects price trends of all the things consumers buy. In contrast, a capital investment deflator would reflect the price trends of capital investment goods, such as buildings, ships, machinery, and software.
There wasn’t a ready-made set of price indices for regional capital investment, so as part of our Insights Paper, we developed some. These are now available for all researchers via the TPI Productivity Lab.
Methodology
Ideally, regional capital investment price indices would reflect regional differences in prices and price trends. For instance, if the cost of constructing a new building increased by 10% in London and 5% in Wales, we would want to capture that fact in our regional deflators. In practice, this cannot be done because there is no systematic data collection on regional prices. The ONS doesn’t publish CPI for different UK regions for the same reason (although it hopes to in future).
The best thing we can do is use national price indices but reflect as much as we can the differences in composition of investment across each region. Investment in each region is a mix of investment by different industries and in different assets, for instance, investment in machinery by the manufacturing industry, investment in software by the finance industry, and so on. Each type of investment, by industry and asset, has its own deflator in national data. We have used these national deflators at the lowest possible level of detail to match with the regional investment data, to construct deflators for investment in each region.
Our regional capital investment deflators dataset, available in the Institute’s Productivity Lab, contains price indices (deflators) for each of the five high-level asset groupings and 19 industries for regions defined by the ITL1 and ITL2 classifications, annually from 1997 to 2020. This includes deflators for each asset and total investment (all assets) by industry, for total asset (across all industries), and total investment (all industries and all assets) within each region. All the price indices are set equal to 100 in 1997, the start of the time series.
In the dataset, we provide the associated current price investment data (published by ONS) alongside our deflators. We haven’t constructed the constant price estimates, as researchers may wish to re-reference the price indices first – for instance, re-referencing them to equal 100 in 2019, such that they can be thought of as expressing prices relative to 2019 prices.
For more detailed information on the deflators and some of our thoughts on their properties, see Annex A of our Insights Paper.
Application
What can you do with these deflators? In section 5.4 of our Insights Paper, we explored the growth of capital investment by region before and after 2016, when the UK voted to leave the EU. Given that changes in growth rates could have been driven by the growth in prices, rather than the growth in real investment, it was important to use deflated (constant price) investment for this analysis.
Other research (see the paper for references) has found that the growth rate of real investment of the UK slowed down substantially after 2016, compared to the rate of growth before this. To our knowledge, this question had not been explored at the regional level before, largely because the necessary data did not exist. We showed that the largest slowdowns in investment growth after 2016, relative to the period before, were in Scotland, the East coast of England (North East, South East, and East of England, but not the East Midlands), and Wales.
All 12 ITL1 regions saw a slowdown relative to the growth rate of 2011-2016, although that was a period of recovery from the 2008-09 global financial crisis and economic downturn, so it might not be a fair comparator. However, comparing against the 1997-2016 period still gives a similar picture. This doesn’t prove that Brexit caused the slowdown, but having data on real business investment for the first time allows new analysis.
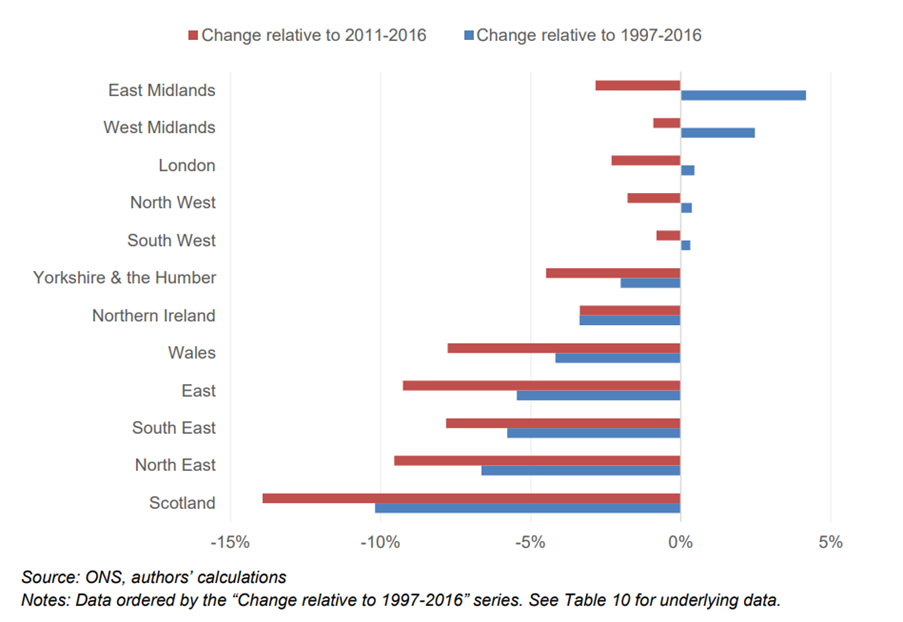
Figure 1 – Change in average annual growth of real market sector investment, 2016-2019 vs earlier period, by ITL1 region
There are many other questions for which regional capital investment in real terms (constant prices) will be more appropriate than in nominal terms (current prices). Deflators for regional capital investment will also be critical for estimate of regional capital stocks, which in turn will be necessary for growth accounting at regional level and thus for regional estimates of Total Factor Productivity (TFP).
The dataset is free to use by other researchers as long as it is properly cited. We hope researchers will find these useful in their own work.