By Ruby Watson, William Sarsfield and Raquel Ortega-Argilés
Introduction
Environment and Natural Capital, understood as the world’s stock of natural resources and ecosystems (i.e., water bodies, air, soil, fossil fuels, biodiversity, renewable energy sources) that provide valuable services to humans and support economic activities, are an integral part of human life, providing a range of benefits from different forms of natural capital. We rely on natural capital not only for resources but also as a mechanism to improve health and wellbeing (Lusardi et al, 2024). However, the assessment of productivity often overlooks the implications of environmental factors, natural capital, and climate change and their implications on growth and productivity (The Productivity Institute, 2024). Traditional and modern growth accounting methodologies, such as the EUKLEMS & INTANProd, have also neglected their importance. Caron (2024) highlights the absence of natural capital in economic frameworks and production functions. The loss of climate stability may explain declining rates of productivity growth, as the erosion of natural capital exerts downward pressure on productivity. Thus, natural capital has shifted from being a productivity driver to being a productivity decelerator.
In summary, natural capital is a foundational element of the economy, influencing everything from resource availability to risk management and sustainable growth. This is why in policy circles, environmental policies have gained greater importance globally over the last decades, especially since the 2015 Paris Agreement. Major countries have initiated efforts to transition to a low-carbon economy. Among them is the UK, with its ambitious Net Zero 2050 strategy, which aims to cut greenhouse gasses or offset any emissions produced by 2050.
Given this increased significance, more emphasis should be placed on measuring the contribution of the environment to growth and productivity, as well as addressing the policy challenges associated with balancing the achievement of net zero while ensuring high levels of productivity and well-being.
The ONS National Well-Being Dashboard
The UK Office of National Statistics (ONS) recognises the importance of wider contributors to growth and well-being in today’s societies and has produced a comprehensive local economy dashboard that includes measures of natural capital.
The ONS dashboard provides measures of national well-being grouped by topic areas, with one area of focus being the environment. Environmental insights are offered by assessing eight indicators:
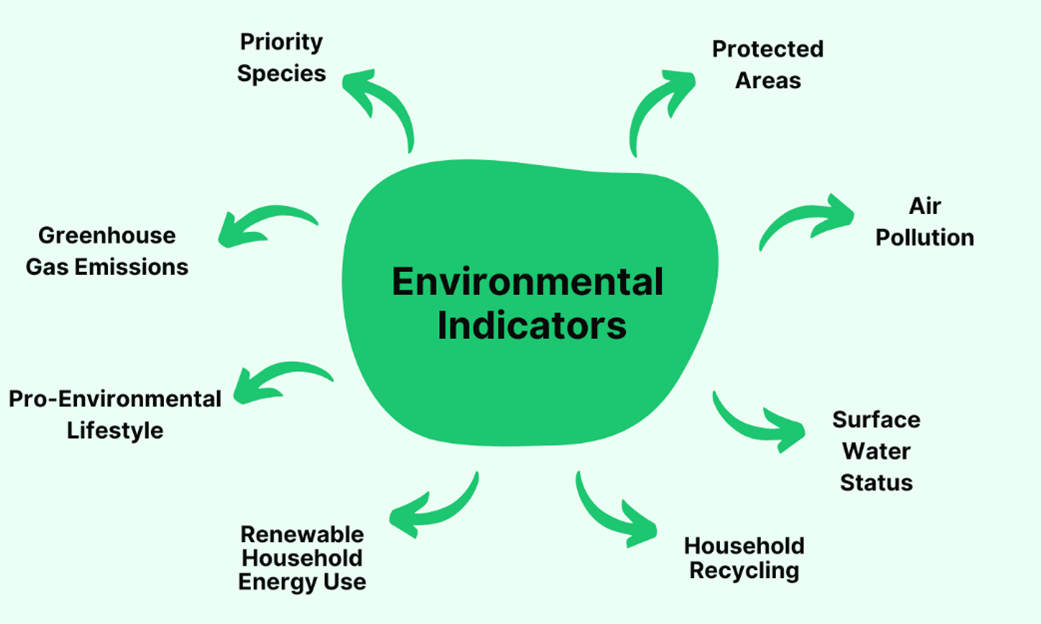
The dashboard indicators are assessed at the UK national level. Four of the eight indicators have shown positive changes, while the other four have seen no change overall.
No change reflects relative stability in the indicator over time. The magnitude of a positive change seen varies across the indicators. For example, renewable energy consumption in 2023 was the highest it has been to date. Other indicators have seen considerable changes over different time periods. Protected areas have increased 42% since 2019 and greenhouse gas emissions are down 52.7% since 1990.
Greenhouse Gas Emissions, Renewable energy use and Household recycling are measured over a period of one year for short-term changes and five years for long-term changes. Pro-environmental lifestyle data does not include enough information to calculate these changes. The remaining indicators vary in their measurement periods for both short-term and long-term changes.
The changes for each indicator are summarised below.
Positive Change:
- Greenhouse Gas Emissions
- Renewable energy use
- Protected Areas
- Air Pollution (Urban sites only)
No Change:
- Household Recycling
- Priority Species (Short term only, negative long-term change)
- Surface Water Status
- Pro-environmental lifestyle
Natural Capital and Productivity
We explore associations between environmental and natural capital indicators and productivity to shed light on potential relationships that may be worth exploring further.
Figure 1 illustrates the association between greenhouse gas emissions per hour worked and productivity, where productivity is measured in gross value added (GVA) per hour worked. The figure indicates that increased productivity is associated with a decline in emissions. However, these relationships could be influenced by multiple confounding factors, indicating a potential spurious relationship, where there exists a relationship between each other but does not necessarily imply a causal relationship between a country’s emission intensity and its labour productivity.
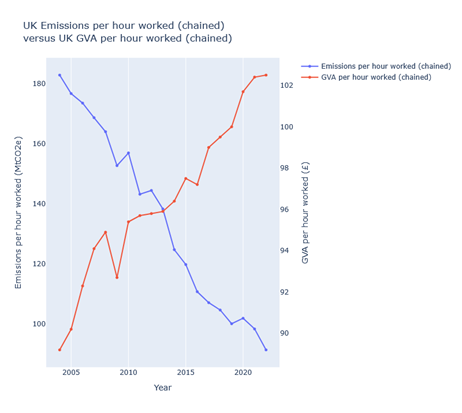
Figure 1: UK Emissions per hour worked and UK labour productivity. Base Year: 2019, Data Source: ONS
To have a better understanding of these relationships at the subnational level, we compare the differences in the evolution of air pollution levels and labour productivity (measured in GVA per hour worked) between UK urban and rural areas (figure 2 and figure 3). Differentiating between urban and rural in this context is important since there is different access to resources between urban and rural areas including different natural capital access. Alongside resource differences, urban and regional areas have different industries and sectors which could result in different environmental harms present. In terms of productivity, urban regions tend to exhibit higher growth and productivity patterns compared to rural regions. The urban and rural data from the wellbeing dashboard follows the ONS regional typology classification. Urban areas are defined as those with a population of 10,000 or more, while rural areas encompass all other regions. GVA data is classified using the OECD regional typology which is also a population-based classification system. Under this system, a region is classified as being predominantly urban if the population share in local rural areas <15% and a region is classified as being predominantly rural if the population share in local rural areas >50%.
The figures illustrate significant disparities in the trends. Urban air pollution levels show a decrease over time, which may indicate transitioning to renewable energies, while rural air pollution levels are increasing. It is interesting to note the drop in urban air pollution levels in cities during the Covid-19 pandemic (2019-2021) and their recovery in 2022.
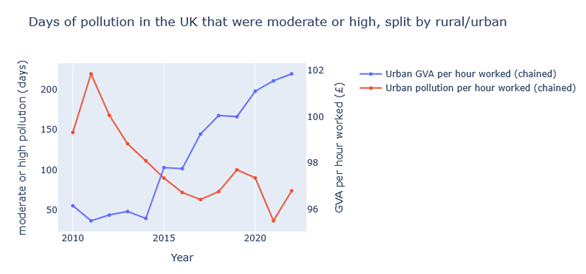
Figure 2: Days of pollution in the UK that were moderate or high for urban areas and labour productivity for urban areas. Base Year:2019. Data Source: ONS
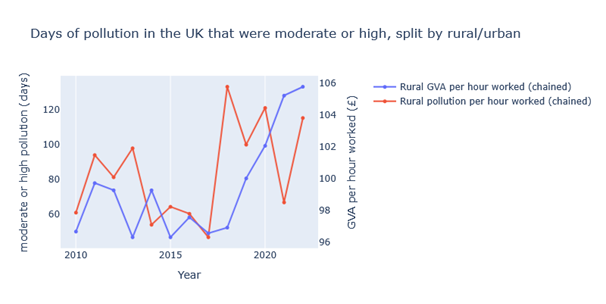
Figure 3: Days of pollution in the UK that were moderate or high for rural areas and labour productivity for rural areas. Base Year: 2019. Data Source: ONS
Based on figure 2, there appears to be a relationship between urban air pollution and urban GVA. figure 3 doesn’t show a clear relationship between rural air pollution and rural GVA. To explore these relationships further, figure 4 shows a scatter plot of urban emissions against urban productivity and rural emissions against rural productivity.
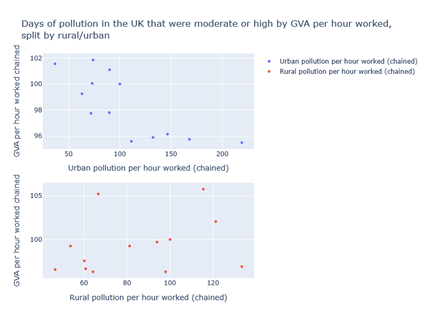
Figure 4: Days of pollution in the UK that were moderate or high in urban and rural areas against urban and rural productivity. Data Source: ONS
Figure 4 indicates a potential relationship between air pollution in urban areas and urban labour productivity, with a moderate negative correlation (-0.77) visible on the scatter plot. The correlation between rural air pollution and rural productivity (0.3) is a much weaker positive one. In both figure 3 and figure 4 there is no apparent relationship between rural area air pollution and labour productivity.
Figure 5 shows renewable energy consumption against productivity (measured in GVA per hour worked). The trends suggest a positive association between renewable energy consumption and productivity. However, there is a break in the trend of renewable energy consumption during the COVID-19 pandemic, which does not seem to affect productivity. This suggests that the relationship between these variables may be spurious rather than indicative of any underlying causal connection, for example, job creation or associated energy costs reductions.
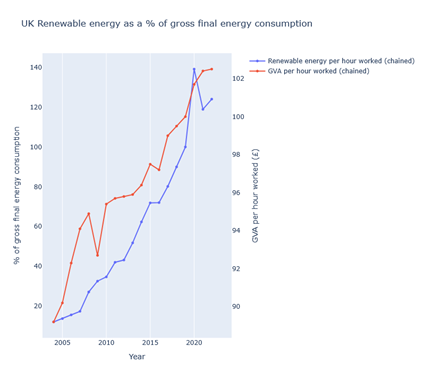
Figure 5: Energy Consumption and GVA per hour worked. Base Year: 2019. Data Source: ONS
Based on figure 1, figure 4 and figure 5, some relationship between productivity and natural capital can be derived. However, as noted, further econometric analysis is needed to verify if there is an underlying causal relationship. Figure 2 suggested a relationship between urban air pollution and productivity, and upon producing figure 4, it appears there could be a correlation between these variables. However, figure 3 and figure 4 showed no evident association between rural air pollution and productivity, suggesting that not all environmental indicators influence productivity equally across space.
Most of the data available on the ONS wellbeing dashboard is only available for the UK or the devolved nations within the UK. Therefore, alternative data sources could be utilised to produce a map showing sub-national variability in greenhouse gas emissions. Figure 6 shows this distribution using UK local authority and regional greenhouse gas emissions statistics.
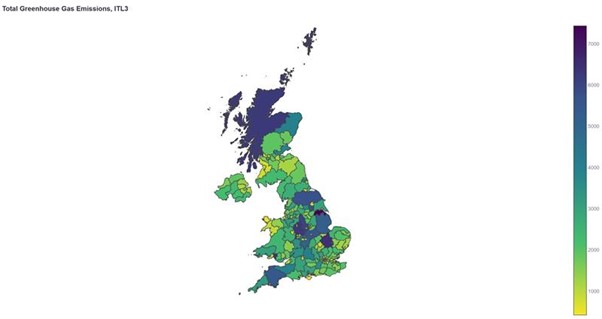
Figure 6: Total Greenhouse Gas Emissions, ITL3. Data Source: Department for Energy Security and Net Zero
Figure 6 reveals the variability in greenhouse gas emissions across the UK. This variability is emissions is based on several factors such as population; transport infrastructures and industrial sectors present within each region. Regions with the highest emissions include Cambridgeshire CC, North and North East Lincolnshire and North Port Talbot. The Highlands and Islands also have notably high emissions. Regions with lower emissions include Torbay, Blackpool and Ipswich.
Looking at the association between greenhouse gas emissions and productivity, figure 7 shows the growth in emissions per capita from 2008-2022 against the growth in GVA per hour worked from 2008-2022 for ITL3 regions.
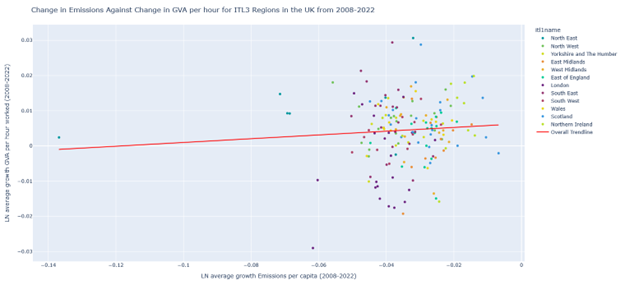
Figure 7: Change in Emissions against Change in GVA per hour for ITL3 regions in the UK from 2008-2022. Data Sources: Department for Energy Security and Net Zero, ONS.
Based on figure 7, the relationship between emissions and productivity at the ITL3 level has a very weak correlation (0.05). Such a weak correlation suggests no relationship between the variables at this level.
Figure 7 also presents an outlier in the data – South Teesside. The figure has been recreated in figure 8 removing this outlier. South Teesside has also been coloured grey to exclude it from interpretation in figure 6.
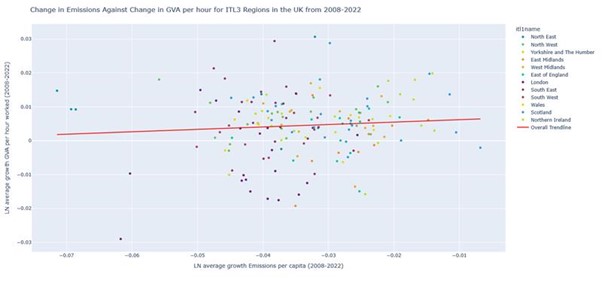
Figure 8: Change in Emissions against Change in GVA per hour for ITL3 regions in the UK from 2008-2022 with South Teesside removed. Data Sources: Department for Energy Security and Net Zero, ONS.
Discussion
The concepts of location of activity and Net Zero 2050 relate to research developed by the TPI in an EsCoE working paper examining the twin transitions. The green domain of the twin transition focuses on a shift towards environmental sustainability, including the development of renewable energy sources and climate change mitigation measures. The green transition presents opportunities for areas specialising in green or green-related industries, particularly rural areas with abundant natural capital. This opportunity could help boost productivity and growth during these transitions. Consideration must be given to the evolution of the green transition in the context of the digital transition and how these transitions will reinforce each other. The digital aspect of the twin transition may offer the opportunity to improve productivity but could also negatively impact emissions.
Discussions should highlight the role of the environment in the economy, especially in the context of moving towards a green economy. As noted, the functioning of the economy is not independent of the natural environment and cannot operate without it. Natural capital is irreplaceable and cannot be substituted with other forms of capital, and depleting stocks of natural capital pose a risk to economic resilience. A successful green economy will shift away from short term economic growth policies which tend to be at the expense of natural capital resources.
Policy measures must prioritise natural capital in decision-making. This is particularly important considering natural capital stocks are being used at a rate faster than they are being replenished. Policy efforts should aim to ensure a sustainable flow of benefits into the future. Policies focusing on productivity and natural capital can be approached from different perspectives, including market, business, and individual environments.
At the individual level, natural capital can provide personal value, wellbeing, and health benefits. Individual actions reflect recognition of these benefits and active efforts to protect and sustain natural capital reserves. This is reflected in the data on the ONS dashboard, with the indicator of a pro-environmental lifestyle. In September 2024, 85.5% of adults in Great Britain reported making environmental lifestyle changes to help tackle environmental issues.
Mission Zero, the independent review of net zero, highlights several policy measures to be considered for advancing a green economy. In the private sector, investment and innovation will drive the development and adoption of low carbon technologies. Net zero therefore has the potential to drive economic growth through the creation of green jobs and the promotion of innovation. Lower environmental costs and less reliance on fossil fuels further brings the potential to strengthen both economic growth and climate targets. It is also worth noting that clean energy industries have been identified as one of the eight growth driving sectors within the UK industrial strategy.
For businesses, policies need to focus towards assisting companies of all sizes in achieving net-zero goals. Policies should be tailored to help maintain productivity while achieving net-zero goals. Some policies involve fiscal incentives for businesses to reduce emissions. Examples of policies include pollution taxing, carbon pricing and green subsidies.
A House of Lords study verifies that the economic benefits of net zero exceed the costs. The cost of inaction on climate policy is projected to increase the cost of climate change as a percentage of GDP from 1.1% to 3.3%.
Therefore, it is imperative to prioritise natural capital in policymaking to ensure sustainable growth and productivity while safeguarding the environment for future generations. Let’s take action now to integrate environmental considerations into our economic assessment and work towards a sustainable future.
References
Caron, C. 2024. Eroding Natural Capital: An Alternative Explanation for the Secular Decline in Productivity Growth. International Productivity Monitor. Centre for the Study of Living Standards. V47, pp109-147.
Cicerone,G., Losacker,S., Ortega-Argilés,R. 2024. Regional Diversification into green and digital economic activities – The case of UK Local Authorities. London. Economics Statistics Centre of Excellence
Department for Business and Trade. 2024. Invest 2035: The UK’s Modern Industrial Strategy. Available at: https://www.gov.uk/government/consultations/invest-2035-the-uks-modern-industrial-strategy/invest-2035-the-uks-modern-industrial-strategy
HM Government. 2021. Net Zero Strategy: Build Back Greener. Department for Business, Energy and Industrial Strategy.
House of Lords Library. 2024. Cost of Net Zero by 2050. Available at: https://lordslibrary.parliament.uk/costs-of-net-zero-by-2050/
Lusardi, J., Rice, P., Craven, J., Hinson, C., Bell, F., Morgan, A., Martin, K., Dobson, M., Sunderland, T., Waters, R. 2024. State of Natural Capital Report for England 2024: Risks to nature and why it matters. Natural England Research Report Number NERR137
Skidmore, C. 2023. Mission Zero: Independent Review of Net Zero. Department or Business, Energy & Industrial Strategy.