By Fatima Garcia Elena and Raquel Ortega-Argiles
In this post, we use new indicators produced by the TPI Productivity Lab to examine disparities in the concentration of digital-intensive firms and the adoption of innovation practices within Mayoral Combined Authorities (MCA) in the UK, highlighting a pronounced north-south spatial divide. The research builds upon previous work by the TPI Productivity lab on productivity in UK MCAs by employing novel methodologies, such as machine learning and text analysis, to measure digital presence and innovation practices across the UK.
Challenges in Measuring Digitalisation and Innovative Practices
Measuring concepts such as firm digitalisation and the adoption of innovative practices in firms, industries, and locations has proved challenging due to data availability, industry and sectoral bias in capturing innovation and technological trends, and a lack of representation at different geographical levels. Given their importance in contributing to the performance of firms, sectors and places, alternative indicators must be developed.
At the TPI Productivity Lab, we benefit from access to the Data City dataset and present an attempt to measure the share of digital-intensive firms and highly innovative firms in a given geographical context.
Creation of Indicators
To provide new evidence, the TPI Productivity Lab has produced two indicators, the TPI MCA Digitalisation Quotient and the TPI MCA Innovation Quotient, using machine-learning-based company classification and website text analysis.
The TPI MCA Digitalisation Quotient
Methodology
The Digitalisation Quotient also follows a location quotient approach, where we calculate the concentration of firms working on digital activities in each MCA compared to the UK’s average. We obtained the total number of companies working in digital activities using the Real-Time Industrial Classification (RTIC), which is The Data City’s machine learning-based company classification methodology,
In short, RTICs are output datasets that group all companies that describe their activity similarly. The model is trained with a set of company websites representative of a sector. Similarly to the Innovation Score calculation process, the algorithm creates a language model that defines the shared linguistics by the company websites and uses it to score the rest of the company websites against it. That way, all companies developing Artificial Intelligence technologies, for example, can be grouped in a dataset. More information about this method can be found on this page.
The Data City has several RTICs representing digital sectors.[1] All the companies classified into one of these sectors will form the total sample for calculating the Digitalisation Quotient. In combination with location information for all companies’ trading addresses, sector classification information allows for the development of location quotient indexes that represent whether an MCA has a larger or lower concentration of digital companies than the UK’s average.
Variables:
- CDIG,MCA: Number of companies classified in a Digital RTIC (Regional Technology and Innovation Centre) in a MCA.
- CURL,MCA: Number of companies with a URL matched in a MCA.
- CDIG,UK: Number of companies classified in a Digital RTIC in the entire UK.
- CURL,UK: Number of companies with a URL matched in the entire UK.
To construct this indicator, we will use the number of companies in the UK with website text information in 2025. Among these companies, we identify the ones that, according to the content of their websites, can be classified in Real-Time Industrial Classes (RTICs) linked with Digital.
Geographic Disparities
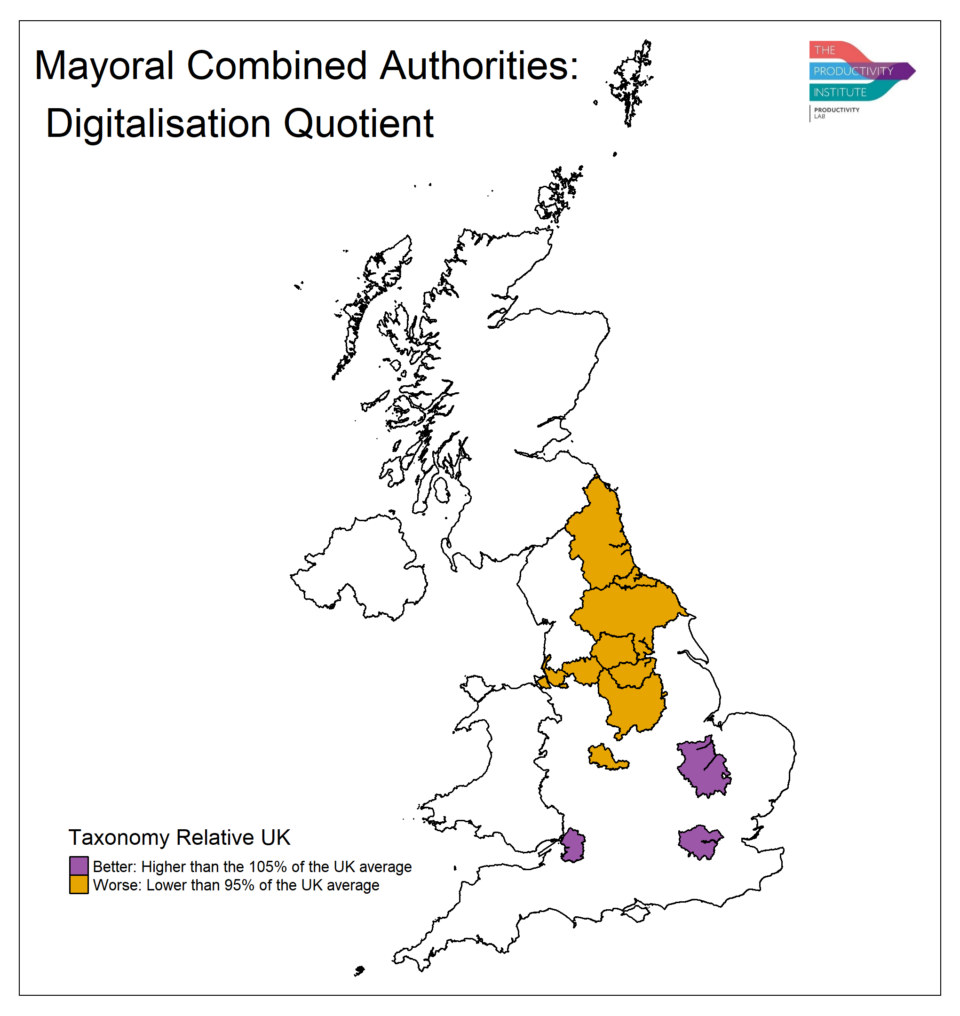
Figure 1. TPI MCA Digitalisation Quotient
Figure 1 represents the spatial distribution of the performance of the Digitalisation Quotient across MCAs in the UK. It reinforces the narrative that areas in southern England are more successful in attracting digital companies than those in northern areas. The Digitalisation Quotient for the Greater London Authority is at 147% of the UK’s average, West of England at 122%, and Cambridge and Peterborough at 109%. The higher prevalence of digital companies in the West of England may be due to Bristol’s strong Gaming and Digital Creative Industries cluster, which has proven to be a hub of innovation in the digital fields.
We find that Tees Valley has the lower share (66%) of digital companies, followed by York and North Yorkshire (74%). It is important to note that the distribution of values for the Digitalisation Quotient is slightly more normalised than that of the Innovation Quotient, the first displaying a standard deviation of 0.199 and the latter 0.218.
The TPI MCA Innovation Quotient
Methodology
This indicator is based on The Data City’s Innovation Score, calculated at the company level. We provide a summary for context here, but more information about the method behind the Innovation Score’s production can be found here.
The Data City (TDC) trained its machine learning technology using the website text of companies which spend heavily on research and development, producing a language model that identifies the shared language patterns across all TDC companies. This language model includes keywords like “research,” “cutting-edge,” and “design thinking” but also other less common keywords, such as “apprenticeship” or “training.” The model is then used to score all the Data City companies’ website text, identifying those that use the same language.
This method produces outputs that provide an innovation score for most of The Data City companies. This data can be combined with trading address data to map the distribution of innovative firms in the UK and allows for developing more interesting indicators. In this case, we applied a location quotient approach, which produces a value relative to the UK average, making it possible to understand the performance of regions from a different angle.
Variables:
- CIS, MCA: Number of companies with an innovation score in a MCA.
- CURL, MCA: Number of companies with a URL matched in the same MCA.
- CIS, UK: Number of companies with an innovation score in the UK.
- CURL, UK: Number of companies with a URL matched in the UK.
There are a couple of important considerations about the calculation. Since Innovation Scores depend on the availability of company website text data, the total UK sample on which the indicator is based is the total number of companies with website text data in a given year (over 1.5 million in 2025). Likewise, we have considered all company trading locations for our regional analysis, acknowledging that one company may display the same behaviour in different geographies.
Geographic Disparities
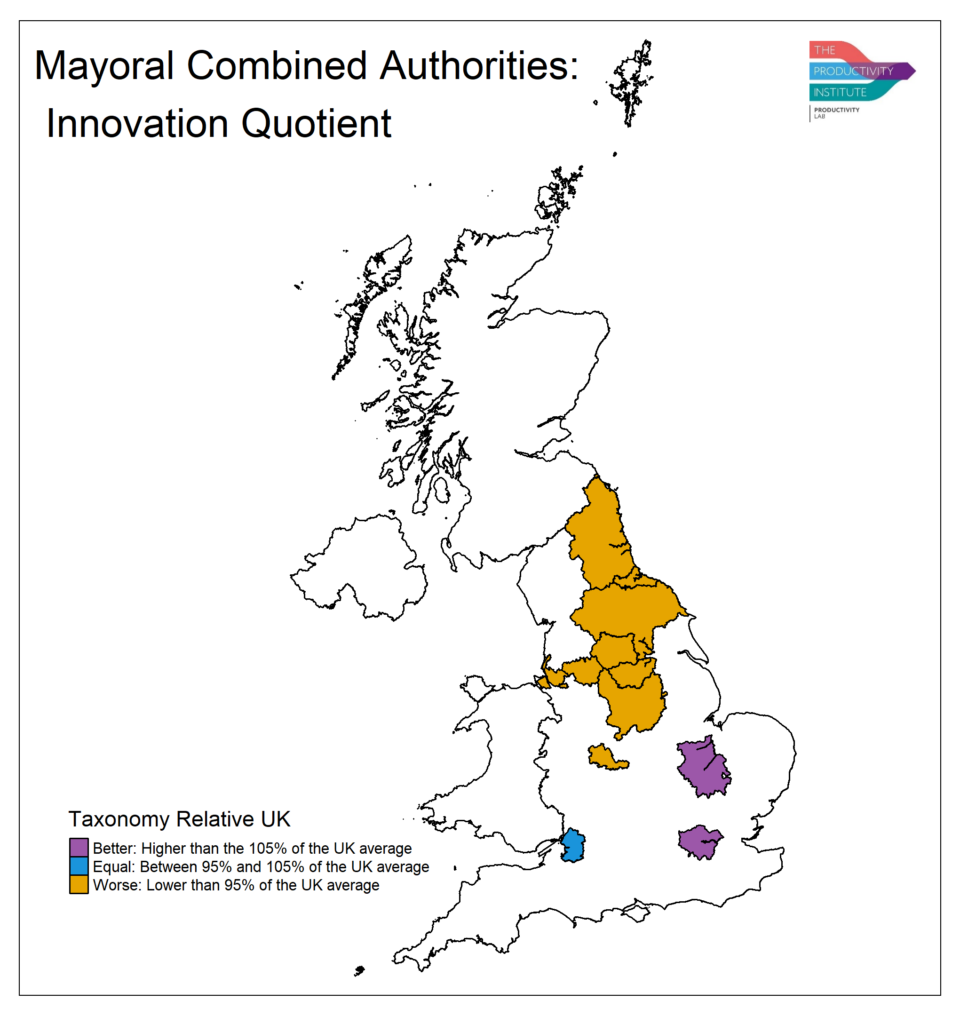
Figure 2. TPI MCA Innovation Quotient
Figure 2 shows that the Greater London Authority has the higher TPI Innovation Quotient (135% of the UK average), followed by Cambridge and Peterborough (113%) and West of England (103%) CAs. This geography of innovation represents the existence of critical research and innovation clusters in Cambridge-Peterborough and London and provides a relative view of the prevalence of these practices. In contrast, Tees Valley, York, and North Yorkshire combined authorities present the lowest values, with 64% and 67% of the UK’s average, respectively.
Other results include Greater Manchester at 84% of the UK’s average Innovation Quotient. Considering the high density of academic institutions, research-intensive companies and tech entrepreneurs, a higher value might have been expected. The difference seems to be due to the limited number of spinout companies in Greater Manchester. While London has 309 spinouts and Cambridge and Peterborough 168, Greater Manchester has only 73 (The Data City, 2025). Considering that the total sample size for London in this analysis is 465,083 companies, for Cambridge and Peterborough 32,228 companies versus 109,995 for Greater Manchester, the difference is evident. More research is needed to understand whether differences in spinout development have a tangible impact on innovative practices across regions.
Relationship with Productivity
These indexes can be analysed together with regional productivity indicators. We used the latest GVA per hour worked data (2022) and mapped MCAs’ performance against the Innovation and Digitalisation Quotients. Higher productivity (referring to 2022) is related to a higher prevalence of innovative and digital firms (which are real-time referring to 2025).
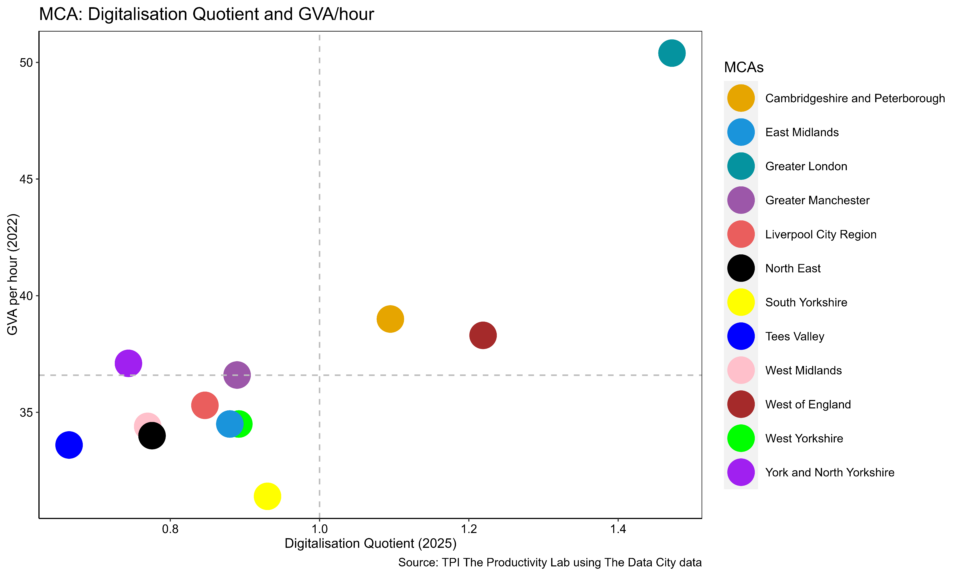
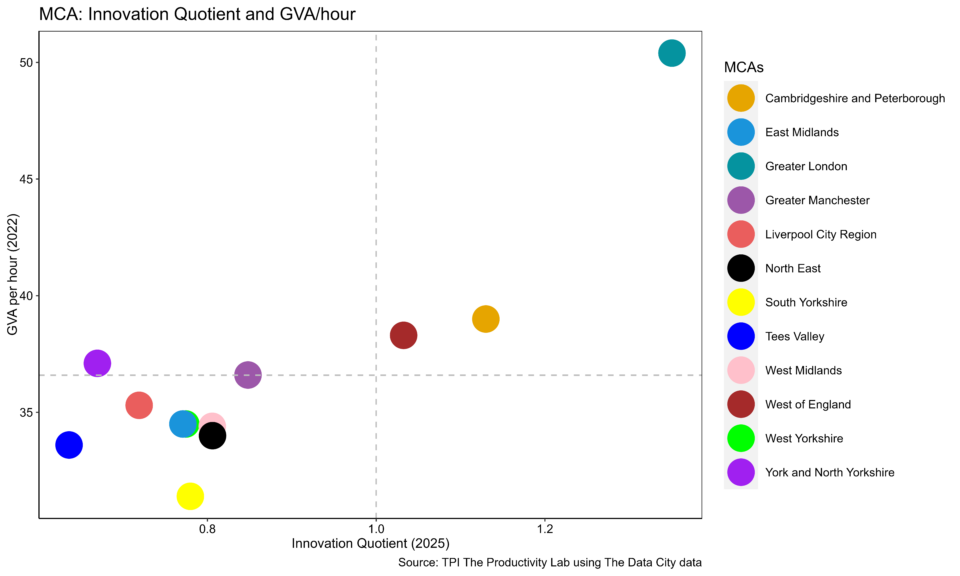
Scatter plots 1 and 2 map the average GVA per hour worked against the MCA’s digitalisation and innovation quotients. The figure illustrates a potential association (not implying causation) between regional productivity, digitalisation, and innovation measures, indicating that areas with higher productivity levels also demonstrate higher levels of digitalisation and innovation (Greater London, Cambridge and Peterborough, West of England).
Scatter plot 1: average GVA per hour worked in 2022 against the digitalisation quotient for all MCAs. The horizontal dashed line indicates the MCAs’ GVA per hour worked average for 2022. The vertical dashed line represents the UK relative average for the prevalence of digital companies.
Scatter plot 2: average GVA per hour worked in 2022 against the innovation quotient for all MCAs. The horizontal dashed line indicates the MCAs’ GVA per hour worked average for 2022. The vertical dashed line represents the UK relative average for the prevalence of innovative companies.
Scatter plots 1 and 2 show a similar performance of MCAs when looking at innovation and digitalisation in 2025 against productivity performance (GVA per hour worked in 2022). For example, the North East and West Midlands have similar GVA values and digitalisation and innovation quotients, suggesting regional similarities and calling for further analysis. The results align with the conclusions drawn from the maps in Figures 1 and 2, as they present the same three MCAs outperforming position the others.
Wrapping up
For effective research into productivity and policy making it is important to measure processes such as innovation and digitalisation at the regional and sectoral levels. The TPI MCA Digitalisation and Innovation Quotients shed light on the prevalence of firms engaging with those practices. The initial geographic analysis applied to the MCAs reinforces the view that southern regions in the UK have been more successful in harnessing digital technologies and innovation practices, creating a geographical divide with regard to innovation and digitalisation.
The added value of these two indicators is that they provide a relative measure that can be related to other variables. For instance, the prevalence of innovative practices and the number of spinout companies in different MCAs can help better understand the influence of research institutions on company behaviour.
Likewise, it is important to understand why, for example, the business population of Tees Valley has been less efficient in adopting innovation practices and developing digital technologies than other MCAs. Hence, the production and open access to data like these indices can help researchers better understand the geography of innovation and digitalisation in the UK and the processes that shaped it.
For more information, visit the TPI Productivity Lab.
[1] The RTICs selected are: Artificial Intelligence, Cyber, Cryptocurrencies Economy, Data Intermediaries, Design and Modelling Technologies, Digital Creative Industries, E-commerce, Fintech, Gaming, Immersive Technologies, Internet of Things, SaaS, Software Development, Streaming Economy
