By Ruby Watson, Joel Hoskins and Raquel Ortega-Argilés
Productivity, in its simplest terms, refers to the ratio of outputs generated from inputs. Looking at public sector productivity, therefore, helps understand how inputs translate into outputs within the public realm. As highlighted by the Office for National Statistics (ONS) and illustrated below, the public sector is comprised of ten distinct service areas: healthcare, education, tax administration, defence, social security and administration, public order and safety, children’s social care, policy and immigration, adult social care, and other government services.
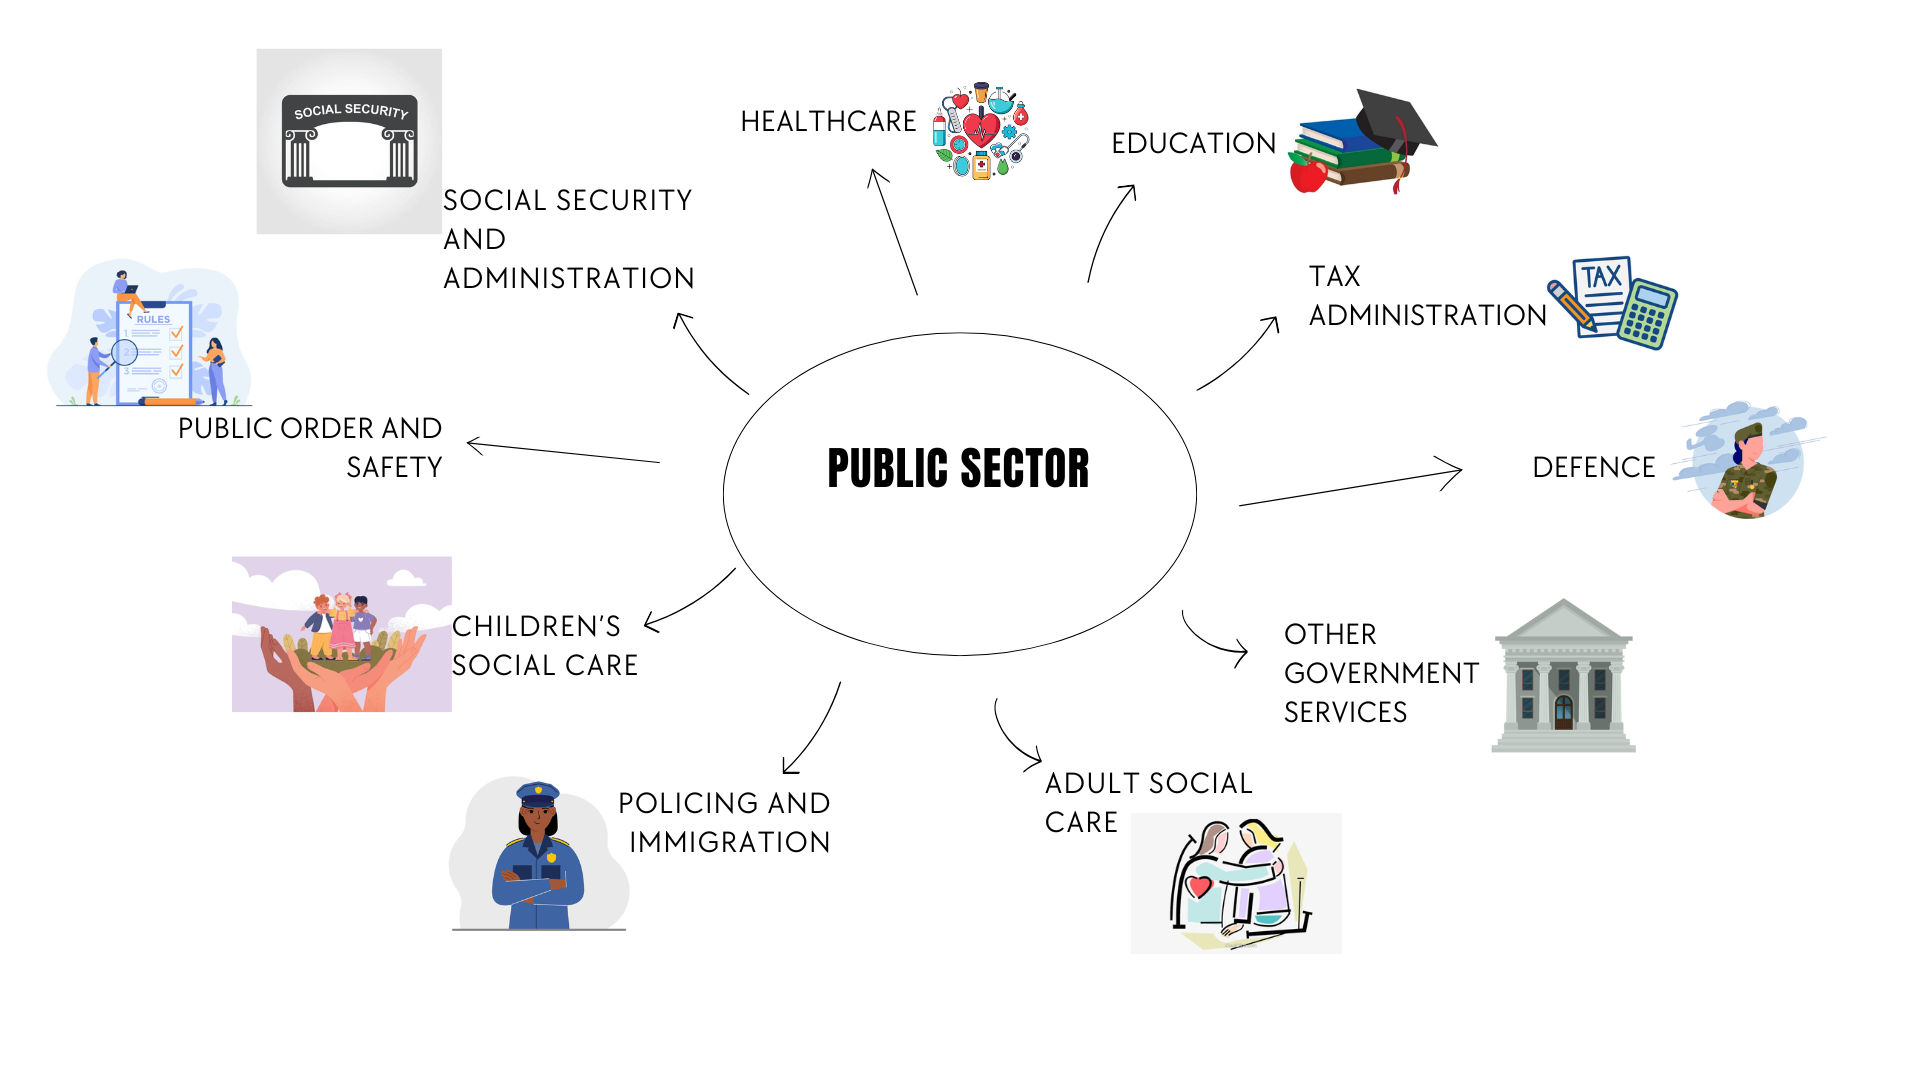
Figure 1: Public Sector Service Areas. Source: Authors’ own elaboration
The public sector accounts for around 20% of the UK’s GDP. Given the important contribution of public sector to our economy and societies, understanding public sector performance is crucial. Public sector performance not only contributes to the driving of economic prosperity but also to the enhancing of societal well-being and quality of life. Even modest improvements in public sector productivity translate in significant, economy-wide impacts. The Guardian warns that if the current decline in public sector productivity continues, an estimated 92,000 additional workers, costing £1.5 billion, may be needed to maintain existing service levels. This is because a decrease in output per worker signifies that more staff are needed to achieve the same results.
One way to understand productivity in the public sector involves looking at the delivery chain, which systematically maps the flow of resources through the public sector – moving from input budgets, to input resources, output activities, and beneficial outcomes for the public. Public sector productivity can therefore be segmented into three areas: budgetary efficiency, defined as the effectiveness with which financial inputs are transformed into input resources; organisational efficiency, which assesses how effectively those resources are turned into output goods and services; and effectiveness, which measures the efficiency with which those outputs deliver beneficial outcomes. Opportunities for improvement exist in all three of these areas. It is worth noting, however, that only improvements in budgetary efficiency can lead to immediate fiscal savings.
Measuring productivity in the public sector, however, presents constraints not typically encountered in the private sector. In the private sector, the presence of market prices makes output measurement relatively straightforward – it is the sum of the price of each good or service, multiplied by the volume provided. By contrast, the public sector lacks market prices as services are often provided for free or with substantial subsidies, meaning that the ‘value’ of each unit of output is more complex to estimate. Furthermore, many services within the public sector lack individual transfers, as their beneficial impact is delivered to the community as a whole. For example, policing tends to carry out activities that make a community marginally safer rather than an individual. These services are sometimes referred to as “one-to-many”. Since no single person is being provided with this service, it is more complex to estimate the value that has been provided.
As a result of these challenges, productivity has typically been measured by equating outputs to the inputs required. Currently, the ONS uses this method to calculate the output of a third of services – and so productivity growth is assumed to be zero. However, this method means that productivity in some areas of the public sector remains static, regardless of whether they increase their performance.
Quality adjustment
An alternative to looking at the conventional input-equal-output method involves quality-adjusting the output data. This methodology involves providing some statistical augmentation, so that a high-quality unit of output makes a greater contribution to the overall estimated volume of output than a low-quality unit. The implementation of quality adjustment follows from the 2005 Atkinson Review which stressed the need to develop a method for accounting for the quality of government services in the national accounts.
In the private sector, price differences among goods and services often serve as indicators of their relative quality. However, as previously stated, there are no market prices within the public sector, and so this cannot be applied. As defined by ONS, quality adjustment in the public sector is ‘a statistical estimate of the change in the quality of a public service’. Quality adjustment allows for the differentiation into output and outcomes in the public sector and helps provide broader insight between the two and their interactions. It helps reflect changes in effectiveness, outcomes or user satisfaction. For example, in the education sector, more students at a school would mean a higher output, which would seem to increase productivity. However, this does not inform about how successful or effective the service provided has been. Looking at educational attainment such as GCSE performance of the students instead would be more beneficial in giving insight into the outcomes of the service. Overall, quality adjustment helps to give a more comprehensive picture of public service performance and may be significant when it comes to productivity implications.
Attributability is a fundamental foundation to consider when applying quality adjustment in public sector productivity. It raises the question: how far we can attribute an observed outcome to the provision of a particular service. For instance, to what extent did schooling contribute to the good grades attained by students? As defined, quality adjustments aim to bridge the gap between outputs and outcomes. However, without clear attributability, there is a risk that too much credit may be given to the service itself, leading to an inflated measure of productivity. It is therefore important to recognise the limitations of quality adjustment. In the case of education, for example, numerous external factors can influence outcomes beyond the service delivered. These include students’ mental well-being, home environments, and personal motivation or interests. Ideally, such factors should be accounted for or incorporated into quality adjustment measures to ensure more accurate measures of productivity.
As discussed in a recent ESCoE report, the United Kingdom has emerged as a leader in developing quality adjusted productivity measures for public services. For example, the ONS healthcare index adjusts hospital and primary care activity not only for volumes of treatments but also for survival rates, health gain estimates, waiting times and patient experience scores; similarly, school outputs are weighted by students’ GCSE attainment, disadvantage gaps and measures of wellbeing such as bullying; and courts, prisons and probation services incorporate recidivism, prison safety, escape rates and case timeliness into their productivity indices. By contrast, other countries have applied more limited or implicit adjustments. Denmark, for instance, only quality adjusts the management of a limited set of maladies using expert-judged weights and incorporates waiting times and patient satisfaction on a piecemeal basis. The Netherlands often relies on stratifying case or loan categories without direct outcome measures, and New Zealand’s school productivity adjustments hinge largely on international test scores for a narrow age cohort, without broader socioemotional or process indicators.
Currently, quality adjustment is applied to six public sector service areas:
- Healthcare
- Education
- Children’s social case
- Adult Social Care
- Public order and safety
- Social Security Administration
Quality adjustment is only applied to annualised statistics.
The latest ONS release includes their quarterly estimates for Public Service Productivity, including Quarter 4 (October – December) of 2024. This release included estimates for both total public service productivity in the UK as well as for healthcare. Healthcare is reported separately in this release as it is the largest individual public sector, accounting for around 39.2% of total government expenditure. It often drives changes observed in overall public sector productivity.
This is the first quarterly release from ONS that incorporates improvements to their accredited annual release following the National Statistician’s independent Review of the Measurement of Public Service Productivity.
The COVID-19 pandemic had a significant impact on public services, markedly altering both inputs and outputs compared to pre-pandemic levels. In 2020, inputs increased due to additional resources allocated to help public services respond to the crisis. However, output declined as many services had to be delivered differently than in 2019, often under mandatory restrictions and with higher associated costs, resulting in reduced efficiency despite the rise in inputs. Revised annualised quarterly data indicates that overall productivity in 2024 has not yet returned to pre-pandemic levels, remaining 4.6% lower than in 2019. While earlier assessments placed the 2023 shortfall at 8.7%, updated figures now show productivity was 4.3% below the 2019 benchmark. Similarly, in the healthcare sector, productivity in 2024 continues to lag behind pre-pandemic performance, standing 4.6% below 2019 levels. The most recent estimates for 2023 also point to a comparable decline, with productivity reported at 9.4% below the pre-pandemic baseline. Quarterly UK public services can be seen in Figure 2, showing inputs, outputs and productivity from 2019.

Figure 2: UK Public Service Productivity, 2019-2024 (Quarterly). Base Year: 2019. Data Source: ONS.
In Quarter 4 of 2024, total public service productivity is estimated to have risen by 0.1% compared to the same period in 2023. This modest increase reflects a 2.6% growth in output, slightly outpacing a 2.5% rise in inputs. Healthcare productivity experienced a more pronounced improvement during the same period, with an estimated growth of 0.8%, driven by output increasing more rapidly than inputs. However, these overall productivity gains were partially offset by declines in areas such as social protection, justice and fire services, as well as in sectors where productivity is expected to remain unchanged, such as military and defence and other indirectly measured government services.
Figure 3 shows the annual total UK public service productivity year-on-year growth. To help with trend identification, the years of 2020 and 2021, which were impacted by the pandemic, have been omitted from the figure. This is due to the fact that the pandemic created anomalies that make the data too unreliable for comparison.
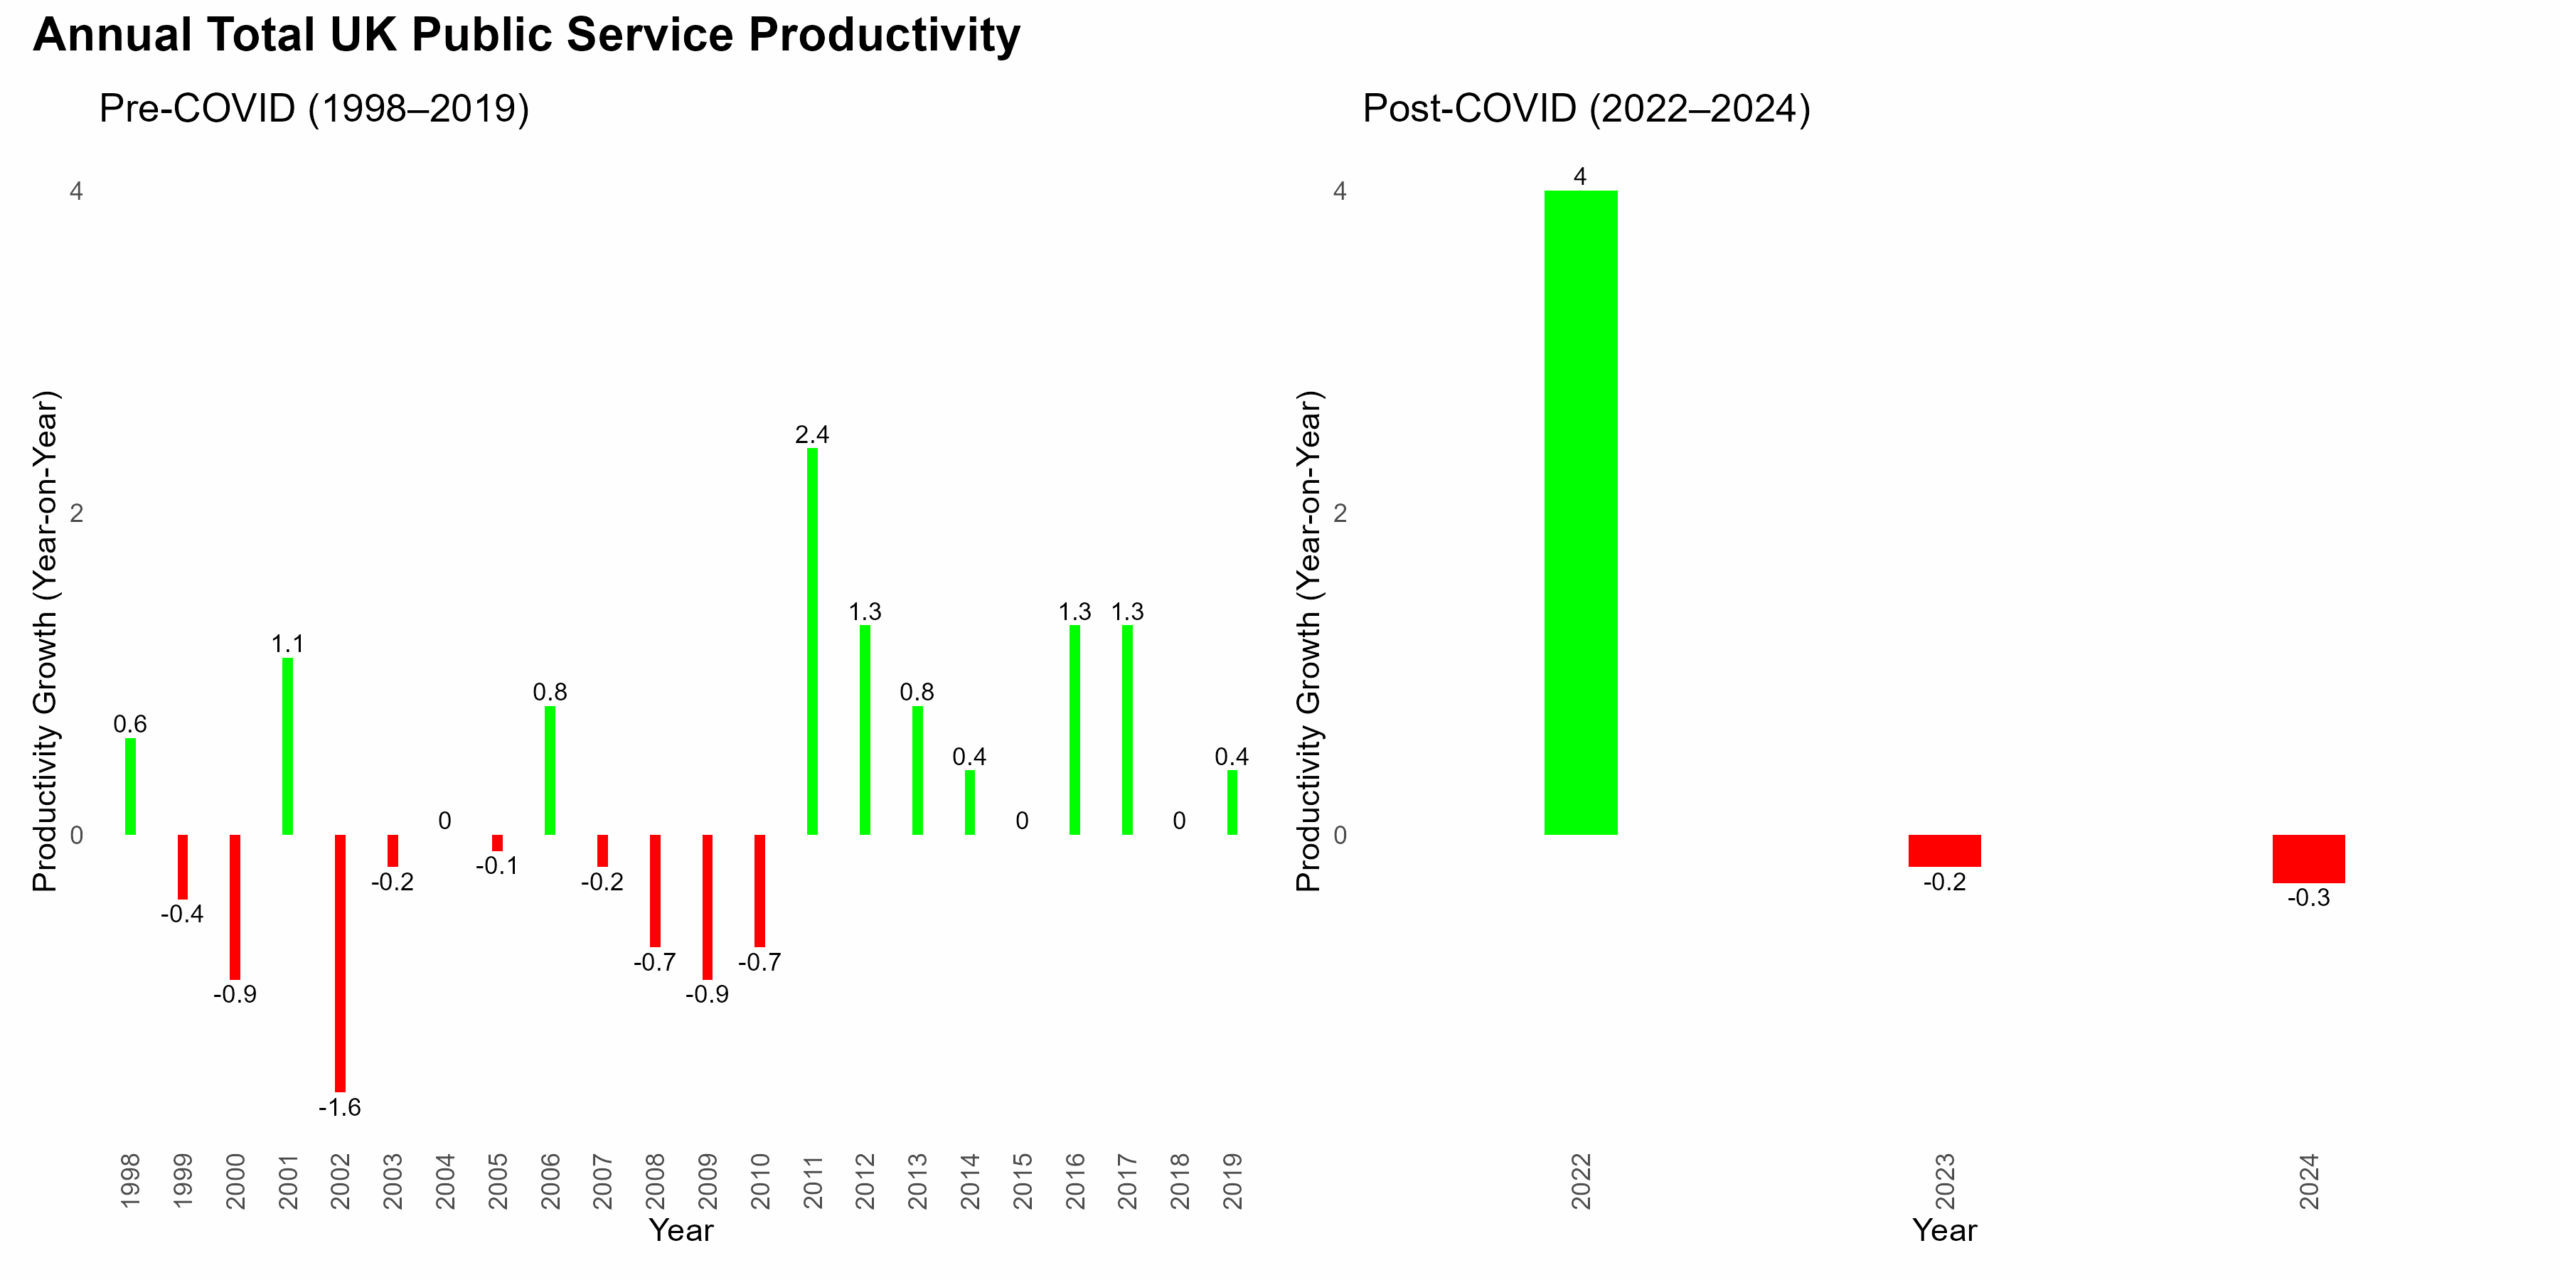
Figure 3: Annual Total UK Public Service Productivity. Data Source: ONS.
As seen in figure 3, prior to 2020, UK total public sector productivity appears to exhibit fluctuating productivity with the absence of a long-term consistent trend. 2020 saw a major decline in productivity (-14.1%), followed by a rebound in 2021 (7.3%). Despite this rebound, growth does not appear to have been sustained, and productivity has been declining for consecutive years.
Public sector services, such as the National Health Service (NHS), experienced a marked decline in performance during the COVID-19 pandemic. While there has been some degree of recovery, progress has stagnated, and service levels continue to fall short of expectations. This is shown below in Figure 4 that illustrates the productivity performance in annual healthcare public services since 1997.
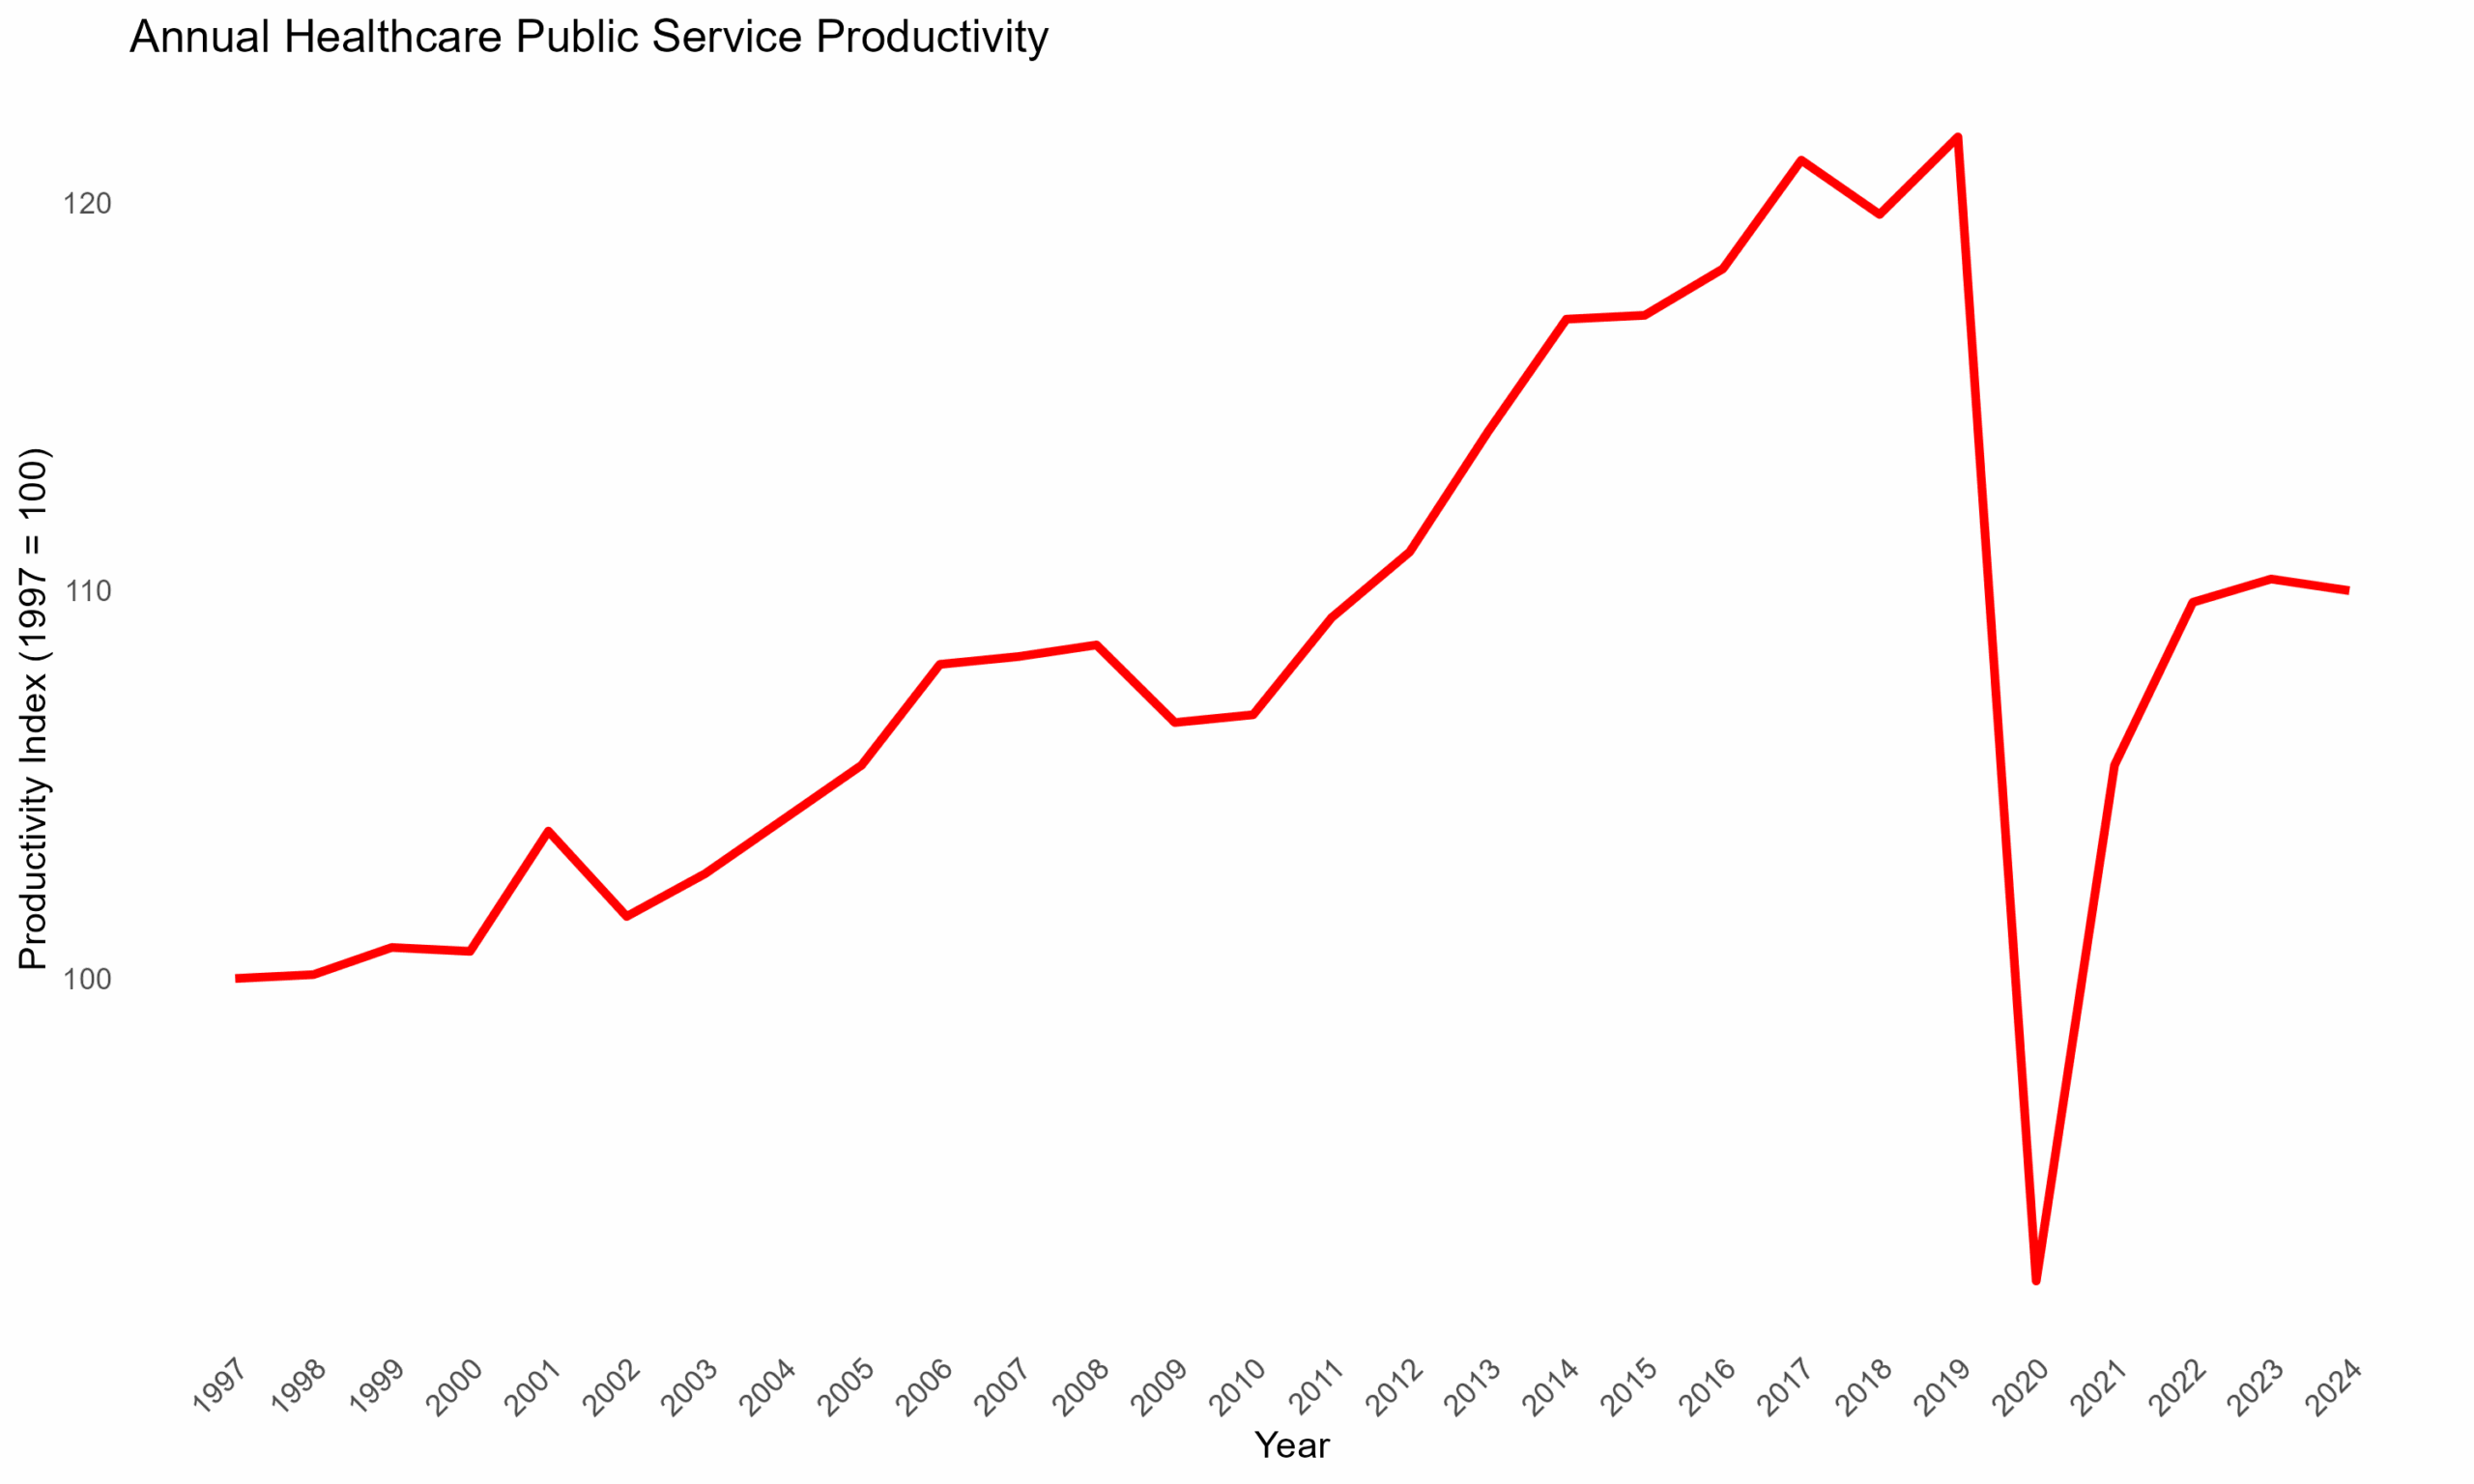
Figure 4: Annual Healthcare Public Service Productivity. Base Year: 1997. Data Source: ONS
Some potential explanations for this include sector-specific issues seen in recent years such as industrial action taken and temporary staffing costs. Lagging growth in public sector productivity may also be attributed to greater funding pressures and increased demand.
Healthcare productivity is estimated to have fallen by 0.3% in 2024. Both inputs and output grew in 2023 and 2024, with output estimated to have risen at a faster rate than inputs in 2023, but not in 2024. Annual Healthcare Productivity year-on-year growth can be seen below in Figure 5.

Figure 5: Annual Healthcare Public Service Productivity. Data Source: ONS.
Similar to figure 3, Figure 5 also displays volatility in public service productivity with no long-term trend. Productivity similarly faced a major decline during the pandemic (-24.2%) to then rebound in 2021 (14.5%).
Figure 6 displays the data for inputs, output and productivity on a quarterly basis from 2019. The red line represents inputs, green for output and blue for productivity. All three metrics have been seasonally adjusted.
While both inputs and outputs generally trend upward, the productivity line remains relatively flat. This means that increases in output could be due to a result of an increase in input resulting in negligible gains in productivity. This shows more resources are being used to maintain productivity levels rather than improve.
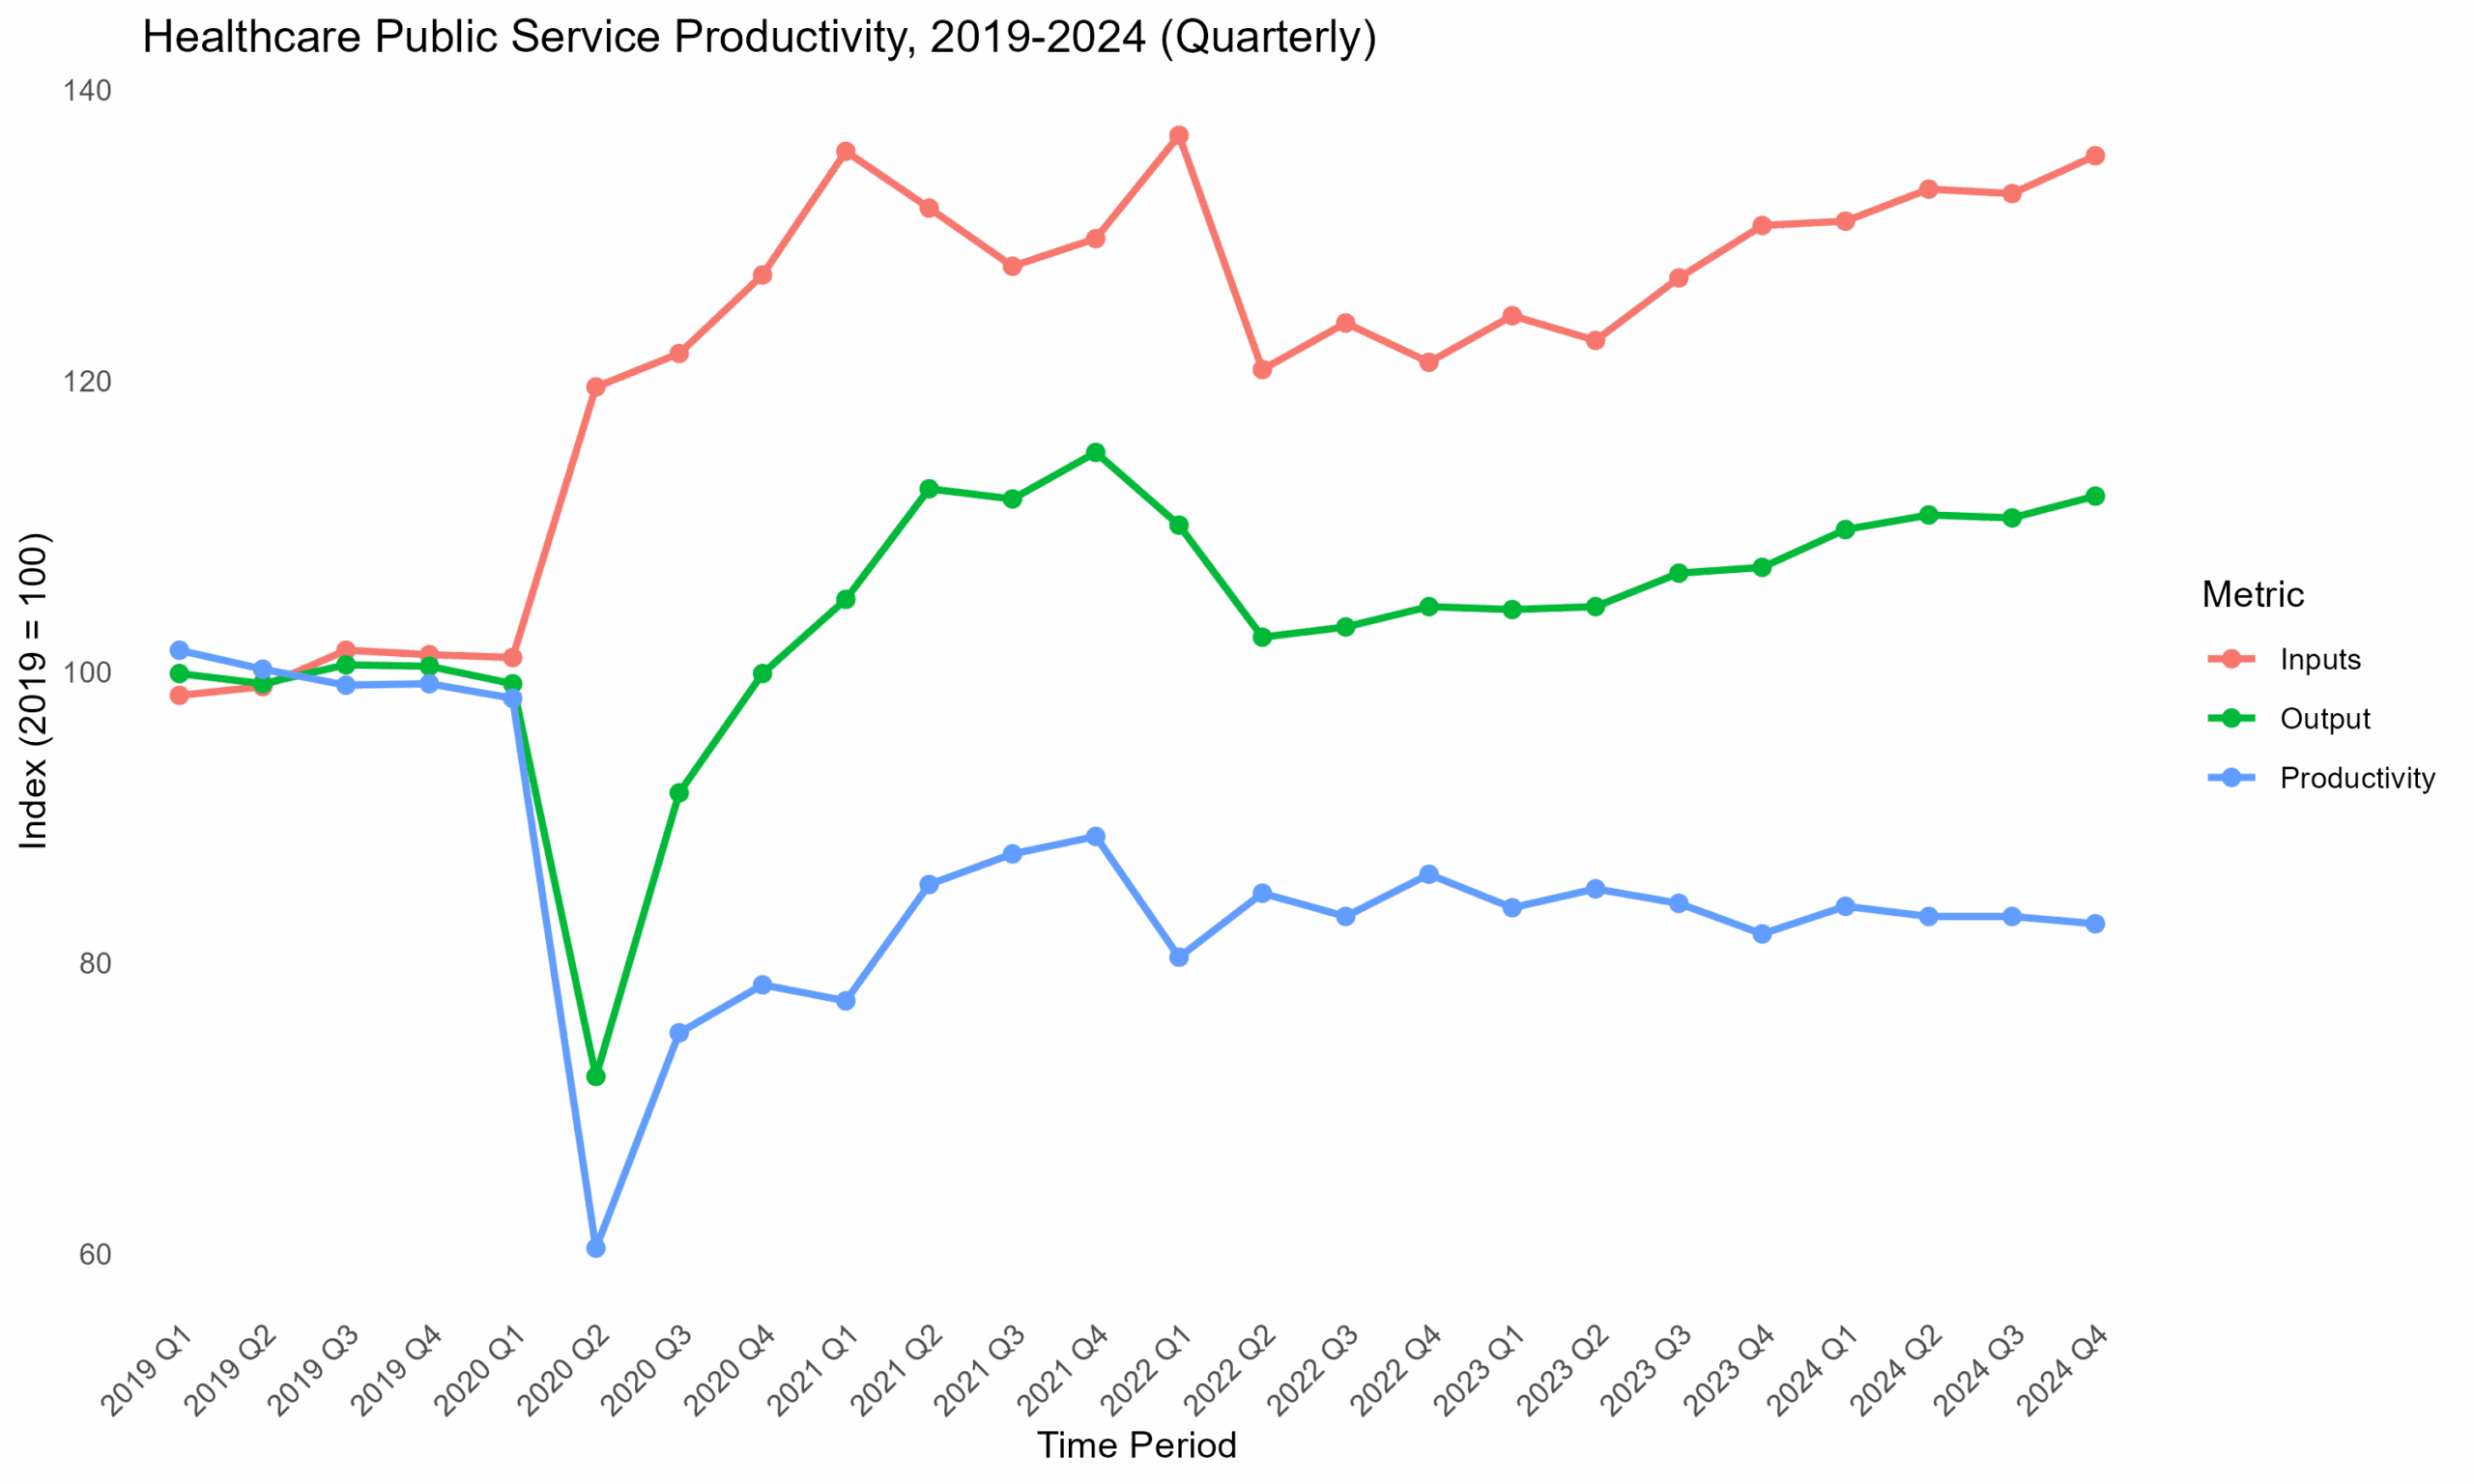
Figure 6: Healthcare Public Service Productivity, 2019-2024 (Quarterly). Base Year :2019. Data Source: ONS
To provide context for public sector productivity, Figure 7 presents the UK’s quarterly gross value added (GVA) from 2019 onwards. Similar to trends in public service productivity, GVA experienced a sharp decline during the coronavirus pandemic. Although, there was rebound in 2021, overall performance has been slow to recover.

Figure 7: Quarterly Comparison of Gross Value Added. Base Year:2019. Data Source: ONS. Figure made using the TPI Lab Quarterly Data Tool.
Outcome Measure
An alternative to quality-adjusted output measures is to gauge the actual welfare gains delivered by public services – in a recent paper, Cutler and co-authors demonstrate this approach in the American healthcare system by using quality-adjusted life years (QALYs) as the productivity numerator and per-patient treatment spending as the input. Unlike traditional output metrics, which count services provided and then apply quality weights, this welfare-based approach directly measures patient benefit, yielding the total societal gain from healthcare interventions. Moreover, because it values outcomes rather than individual service volumes, it inherently captures substitution effects – if, for example, a new medication provides nearly the same QALYs as an expensive surgery at lower cost, the resulting productivity gain is immediately apparent without complex recalibration. These substitution effects are difficult to capture using the quality-adjustment methodology.
This welfare‐based approach is feasible in only a handful of settings where outcomes can be quantified in uniform, comparable units, and where there is robust, comprehensive and regular data collection. Few public services currently provide standardised welfare metrics: education outcomes, environmental improvements or public safety impacts, for example, lack universally accepted measures analogous to QALYs. Moreover, developing reliable outcome models is time- and resource-intensive, so only sectors with extensive research, consistent data collection and clear causal links between inputs and welfare gains can realistically adopt this methodology.
Future Outlook on Public Sector Productivity
Based on the trends observed in the quarterly productivity sector performance from Q1 2019 to Q4 2024 (Figure 2), we can make several predictions about the future of public sector productivity. The red line, which shows an initial dip around Q2 2020 but then recovers and fluctuates around the index value of 110-115, suggests that this category has the potential for continued stability and moderate growth. The green line, which dips significantly around Q2 2020 but remains relatively flat afterward, indicates that this category may face challenges in achieving significant growth unless there are substantial changes in policy or resource allocation. The blue line, which shows consistent growth in some fluctuations, starting at an index value of about 100 in early quarters and reaching approximately 120 by the end of the period, suggests that this category is likely to continue its upward trend, driven by ongoing improvements and innovations.
Looking ahead, several factors could influence public sector productivity. Technological advancements, such as the adoption of artificial intelligence and automation, could streamline processes and improve efficiency. Policy changes aimed at increasing investment in public services and enhancing workforce skills could also contribute to productivity gains. Additionally, the lessons learned from the COVID-19 pandemic, including the importance of flexibility, agility and resilience, could lead to more adaptive and responsive public sector practices.
Conclusion
Public sector productivity is a vital factor in understanding the UK’s broader productivity puzzle, especially given the economy’s sluggish growth since the 2008 financial crisis and its relative decline compared to other nations.
Measuring productivity in the public sector is crucial for understanding how inputs translate into outputs and for identifying opportunities for improvement. The (quarterly) performance analysis here presented provides interesting insights into the trends and challenges faced by different categories within the public sector. While some other categories have shown stability and growth, others have struggled to recover from the impacts of the pandemic.
However, as seen with the data, public sector productivity in the UK has not yet returned to its pre-pandemic levels. While service disruptions during the pandemic initially explained this decline, this rationale no longer fully accounts for the continued underperformance.
To enhance public sector productivity, it is essential to focus on areas such as budgetary efficiency, organisational efficiency, and effectiveness. Quality adjustment methodologies and outcome-based measures offer more nuanced insights into productivity, but they are constrained by issues of data availability and attributability. As the UK continues to develop and refine its productivity measures, it is important to recognise the limitations and strive for more accurate and comprehensive assessments.
Ultimately, improving public sector productivity is not only about better service delivery but also about relieving fiscal pressure and driving economic prosperity and wellbeing. By leveraging technological advancements, policy changes, and lessons learnt from past challenges, the public sector can achieve significant gains in productivity and contribute to a more prosperous economy and resilient society.
If you are interested in knowing more about the latest data on public sector productivity, visit the ONS’ quarterly public sector productivity bulletin.
References
Cutler, D,M., Ghosh, K., Messer, K,L., Raghunathan, T., Rosen, A,B., Stewart, S,T. 2022. A Satellite Account for Health in the United States. American Economic Review. 112(2): 494-533.