The Productivity Institute UK Intangible Growth Accounting dataset (2022) is a granular industry dataset covering the market sector of the economy, including information on the growth of output, productivity, prices, capital and labour inputs, and sources-of-growth contributions. It allows for a comprehensive analysis of UK productivity, which includes contributions of intangible capital to (intangible-adjusted) output growth for the UK market sector.
Source: Corrado et al. (2022) DOI: 10.1257/jep.36.3.3
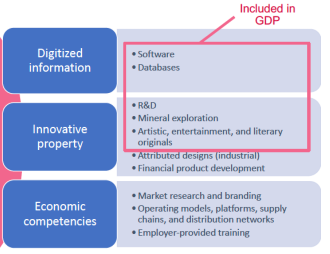
- The first includes all outputs and inputs as agreed in the System of National Accounts, including intangible assets such as software, database, research & development, mineral exploration, artistic, entertainment & literary originals. (See, for example, ONS here)
- The second applies a broader framework of intangible assets as developed in the Corrado, Hulten and Sichel (2005, CHS) framework, which also includes outputs and inputs from industrial design, financial product development, market research and branding, organisational competencies and employer-provided training.
This data set uses the latest data from ONS on UK intangible investment at a detailed asset and industry level enhanced, where required, with data from other sources, such as OECD and Eurostat. The data are for 42 non-farm market sector industries from the UK Standard Industrial Classification (SIC 2007) from 1998 to 2019. The data are integrated with the national accounts, consistent with the Blue Book 2021. They, therefore, incorporate the latest improvements in the measurement of output, such as double-deflated value-added estimates and updated price indices. A full description of the data, variables and construction can be found in Goodridge and Haskel (2022) and an accompanying methods note.
The analysis of the dataset in Goodridge and Haskel (2022) shows that the slowdown in UK labour productivity growth can largely be attributed to a slowdown in innovation. Innovation is defined as the contributions of increased use of intangible capital per hour worked, known as intangible capital deepening and Total Factor Productivity (TFP) growth. Since the financial crisis, the UK labour productivity downtrend can be attributed to a decline in Total Factor Productivity (TFP) growth as well as to a slowdown in the contributions of tangible and intangible capital deepening.
The authors show that the productivity slowdown observed in the UK in the latest decade (2007-2019) since the onset of the Global Financial Crisis appears to be concentrated in the more intangible-intensive industries, which are characterised by an intensive usage of knowledge and digital information. The following figure presents the correlation between industry slowdowns in labour productivity growth and their measure of intangible intensity.
Notes to figure: scatters refer to the industry mean intangible intensity (2001-07, x-axis), measured as industry payments to the full list of intangible capital as a proportion of (adjusted) industry value added in the UK non-farm market sector vis-à-vis the change in labour productivity growth between 2000-2007 and 2007-2019 (y-axis). The growth rates here are calculated as changes in the natural log. Acceleration estimated as the change in mean values between periods: Δ(ΔlnX) = ΔlnX07t19 – ΔlnX00t07. A negative correlation means that the slowdown was greater in more intangible-intensive industries. Each data point represents an industry. The industry weight in nominal (adjusted) value-added terms determines the bubble size.
In terms of industry breakdown, the findings show that the most considerable slowdowns in post-crisis labour productivity growth can be found in sectors such as pharmaceuticals (C21), manufacture of machinery (C28), manufacture of ICT equipment (C26), research and development (M72), manufacture of transport equipment (C29t30), finance (K64t66), IT and information services (J62t63), manufacture of textiles (C13t15) and publishing and broadcasting activities (J58t60), which all have above-average intangible intensity in the pre-recession period.
The TPI UK Intangible Growth-Accounting dataset provides a unique and comprehensive industrial coverage only for the UK. Harmonised international estimates with a somewhat reduced granularity and some differences in sources and methods for measuring intangible investment to improve comparability across countries are also available from the Luiss Lab of European Economics (LLEE).
Dataset created by Peter Goodridge and Jonathan Haskel
Data visualisations by Reitze Gouma
Blog written by Peter Goodridge, Reitze Gouma and Raquel Ortega-Argilés