By Raquel Ortega-Argilés, Olga Menukhin and Fokke Reitze Gouma
The TPI Productivity Dashboards are interactive representations of the UK TPI Lab’s ITL3 Scorecard Series, published in October 2023. These dashboards have been created as a visualisation tool to fulfil the need for relevant data to allow policymakers to compare regional productivity performances across the country and to identify regional drivers that facilitate or hinder productivity in different UK geographic areas.
Using The Productivity Institute’s Productivity Dashboards, policymakers and stakeholders can drill down to sub-regional levels and productivity measure perspectives. The Dashboards offer an interactive and easy-to-use way to build a picture of productivity at different points in time.
TPI UK ITL3 interactive
| ITL code | ITL1 Region | ITL code | ITL1 Region |
| TLF | East Midlands | TLM | Scotland |
| TLH | East of England | TLJ | South East |
| TLI | London | TLK | South West |
| TLC | North East | TLL | Wales |
| TLD | North West | TLG | West Midlands |
| TLN | Northern Ireland | TLE | Yorkshire and The Humber |
Here are some examples of the type of questions the Dashboards can help to answer.
What is the UK’s most productive region?
The UK (ITL1) TPI Productivity Dashboard provides a platform for interregional productivity comparisons at the national level. The country’s productivity performance can be examined by comparing ITL1 total productivity (Gross Value Added per hour worked) conveniently sorted by top performers in the latest year on a bar chart or by taking a closer look at the associated productivity measures using a navigation slider to see changes in each area in the last three years. Additionally, a colour-coded map illustrates each ITL1 area’s performance for the selected productivity measure relative to the UK (ITL1) median. As seen in the illustration below, London appears to be the top productivity performer compared to the other UK ITL1 regions. Finally, a spider diagram creates a centralised visualisation of the geographical areas arranged from strong to weak (clockwise).
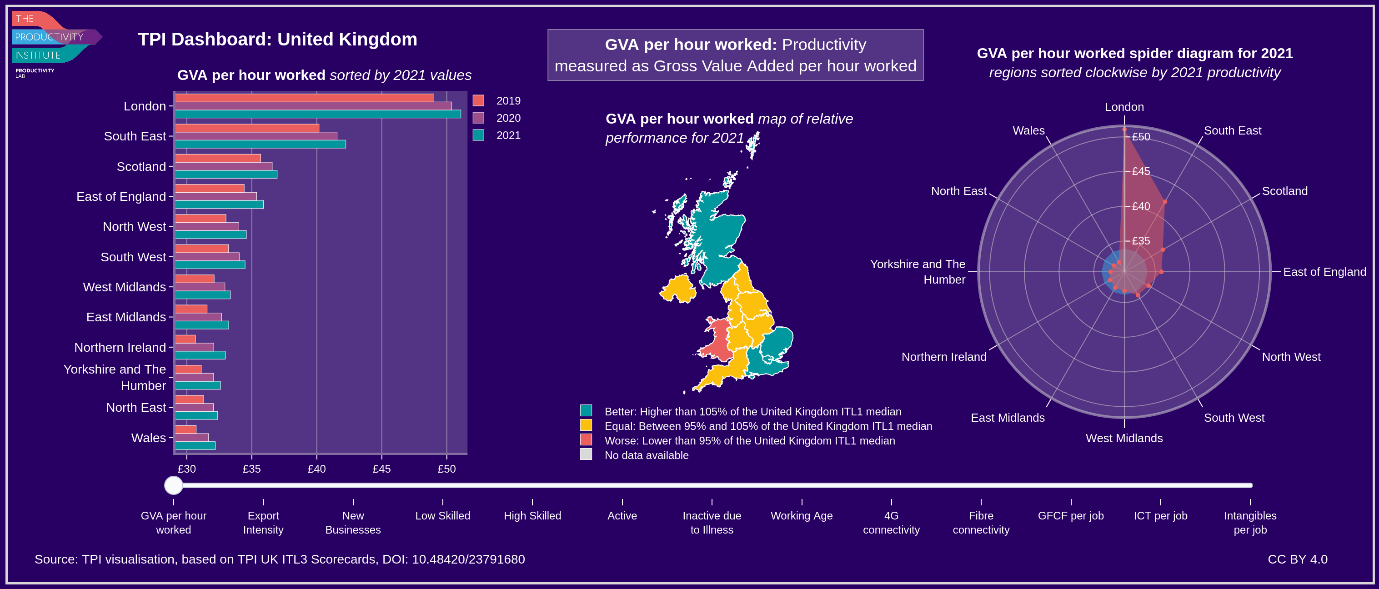
Source: UK TPI Productivity Dashboard
Which is the UK’s top performer region in Business Creation?
The UK TPI Productivity Dashboard allows interregional productivity driver performance comparisons at the ITL1 level.
The regional TPI Productivity Dashboards allow inter-regional (ITL1) and intra-regional (ITL3) comparisons of productivity drivers’ performance. Users can compare the productivity driver performance across the country at ITL1 level or perform an intraregional comparison analysis using the TPI (ITL3) Productivity Dashboards for each ITL1 area. To delve into the regional performance by productivity indicator, the Dashboard will show its level and the relative performance in all ITL3 regions within the same ITL1, or ITL3 regions across different ITL1s.
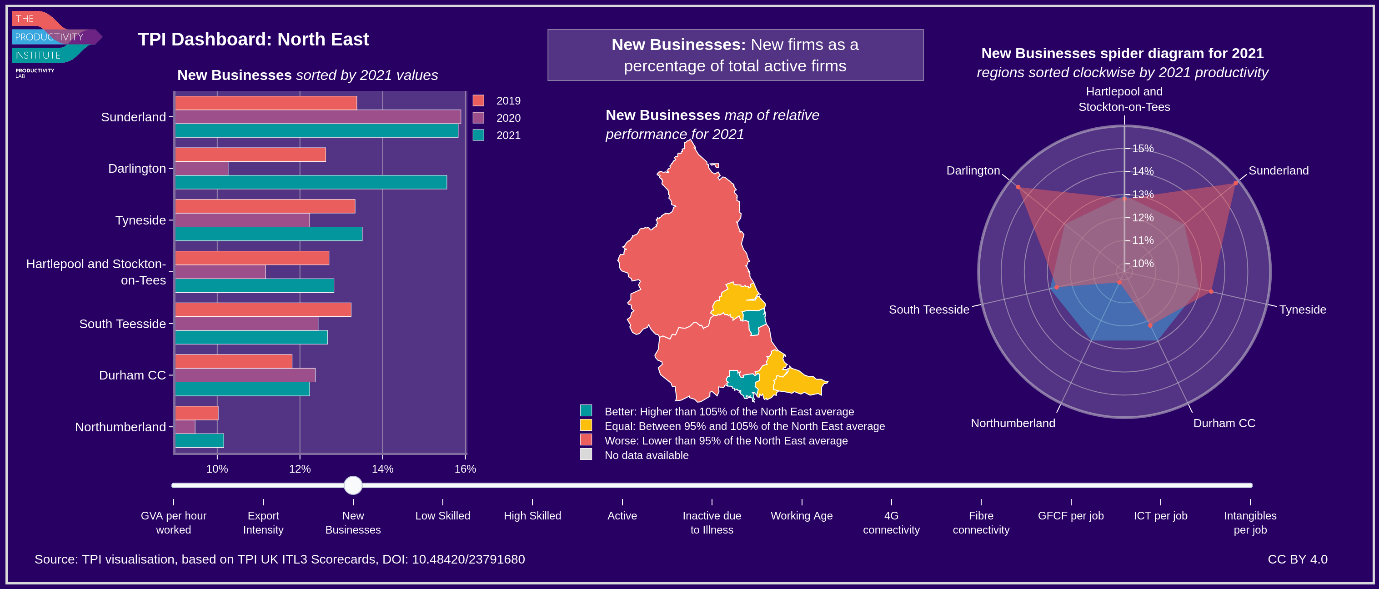
Source: TPI North East Productivity Dashboard
We can gain valuable insights into the performance of North East regions by combining data from the UK TPI Productivity Dashboard and the TPI North East Productivity Dashboard. This will allow us to compare the productivity of North East ITL3 regions (e.g. Sunderland in the North East) with other ITL3 areas across the country (e.g., Wirral in the North West) as well as assess the performance of ITL3 regions within the North East (e.g., Sunderland and Northumberland).
For example, the North East is considered a moderate performer in New Business creation. The areas that appear to excel in this productivity driver within the North East are Darlington and Sunderland. Northumberland is a sub-regional area that should be dedicated more policy attention when it comes to new business creation as it shows a deficient relative performance compared to the average sub-regional North East values.
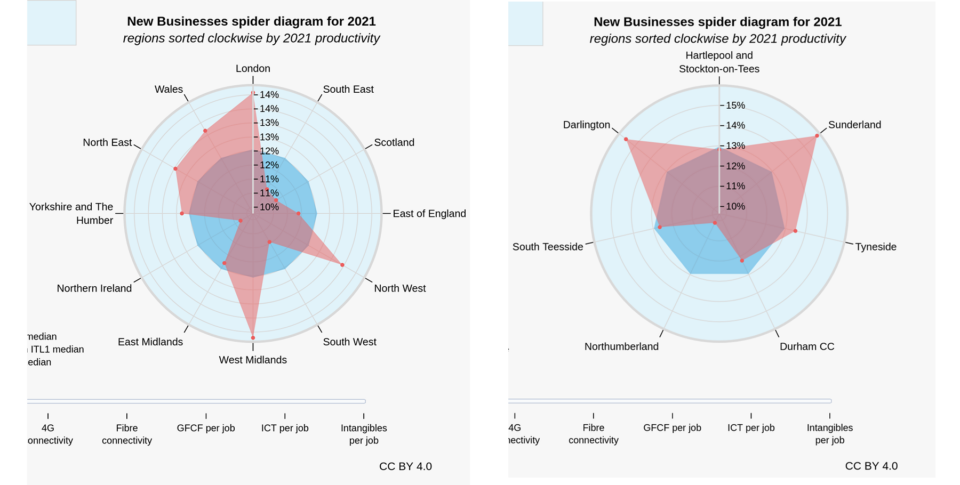
Source: UK TPI Productivity Dashboard (left) and TPI North East Productivity Dashboard (right)
How has the participation of low-skilled workers changed in recent years across the UK?
The UK TPI Productivity Dashboard includes performance information for most productivity drivers for the years 2019, 2020 and 2021. Users can rank productivity drivers’ performance at different levels of geography (ITL1 and ITL3) across this period. Within the North East, low-skilled workers’ participation has presented a variable performance across the years, with Sunderland showing higher rates in 2021. In the case of the North West, the sub-region (ITL3) with the higher low-skilled worker participation is the South West of Greater Manchester, followed by Cheshire East.
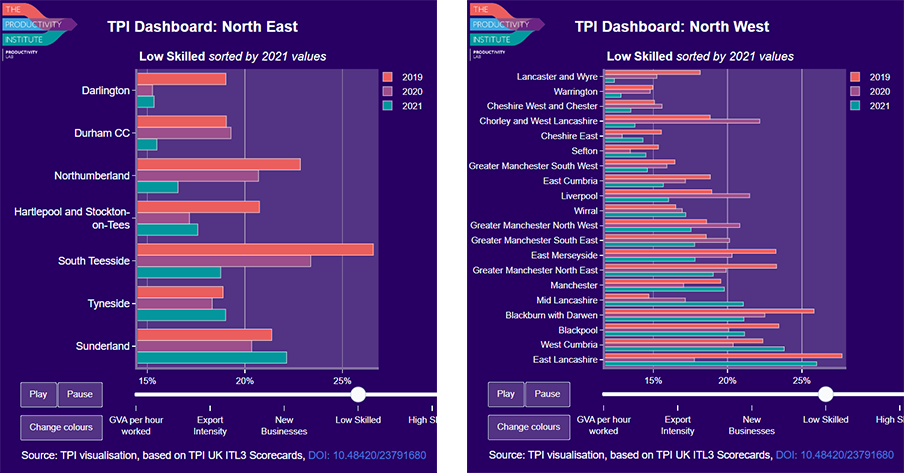
Left: Low skills over time, North East (ITL1/ITL3), Right: Low skills over time, North West (ITL1/ITL3)
Source: TPI North East Productivity Dashboard (left) and TPI North West Productivity Dashboard (right)
Limitations
The Dashboards have been created to assist policymakers in policy design and investment strategy. However, there are some limitations to this pioneering version. It does not allow users to compare several regions simultaneously. To make inter-regional comparisons of productivity dimensions at ITL1 and ITL3 levels, users need to look at different dashboards, for instance, North East vs North West or Manchester vs Leeds. Also, the dashboards do not yet allow for visual comparison of a particular productivity driver, for example Skills, across all ITL1 geographies or in ITL3 sub-regions of interest. For such cases, we advise to look at the individual Dashboards or actual TPI ITL3 Productivity Scorecard Series. These and other potential limitations will be addressed in subsequent editions.