By Alfonso Silva-Ruiz and Raquel Ortega-Argilés
Growth accounts: a foundation for productivity analysis
To understand productivity trends across countries, the official national accounts constructed by nations’ statistical agencies provide the basis for the creation of internationally comparable growth accounts. Building on the pioneering work of Griliches and Jorgenson (1967) and Jorgenson, Gollop and Fraumeni (1987), growth accounts were developed for EU countries for the first time in the early 2000s (O’Mahony and Timmer, 2009; Timmer et al. 2010). These growth accounts are named EU KLEMS (where K, L, E, M, and S refer to the traditional inputs: capital, labour, energy, material and service inputs, respectively), and serve as a comprehensive resource for productivity-related data at the sectoral and national levels.
The latest version of this growth accounting database, the EUKLEMS & INTANProd database (January 2025), is a novel addition as it not only updates the figures to 2021 but also expands the growth accounting approach by incorporating measures of intangible capital. The dataset contains detailed information on relevant variables used to study productivity, including output, intermediate inputs, gross value added, employment, wages and investment in tangible and intangible capital stocks. It provides extensive coverage, spanning the 27 EU Member States, the US, Japan, and the United Kingdom across 40 sectors (including 13 manufacturing industries) and 23 industry aggregations from 1995 to 2021. The 2025 EUKLEMS & INTANProd release provides insights into the latest productivity trends, including new harmonised estimates of investments and capital stocks in intangible assets not included in national accounts. As a result, the database has become a key reference for academics and policymakers studying productivity and how different components of intangible capital impact its growth (Corrado et al., 2022; Corrado et al., 2024). In this article, we review key insights from the latest release.
Discussing the latest productivity trends
Figure 1 presents annual growth rates for four economies. Recent data reveal a post-COVID-19 recovery in labour productivity, measured by Gross Value Added (GVA) per hour, with varying speeds across different economies. In 2020-2021, the US posted an 8.6 % cumulative growth in real GVA per hour, followed by Japan at 1.9%. The EU11 remained relatively stable at 0.9% on average in 2020-2021, while the UK experienced a 6.8% contraction.
Figure 1. Real annual growth of GVA per hour. Growth rates are computed using log increments over the real GVA series and are adjusted by inflation. Source: The Productivity Institute with data from EUKLEMS & INTANProd.
Figure 1 shows negative growth rates and a no-bounce effect for the UK after the pandemic, at least not until 2022 (which is not included in the data). Data suggests that the UK’s productivity was considerably more affected by COVID-19 relative to other relevant global players. What might explain this decoupling from comparator regions, such as the EU or Japan? The EUKLEMS & INTANProd database provides the sectoral granularity needed to enable researchers to investigate the main sectors driving such a contraction.
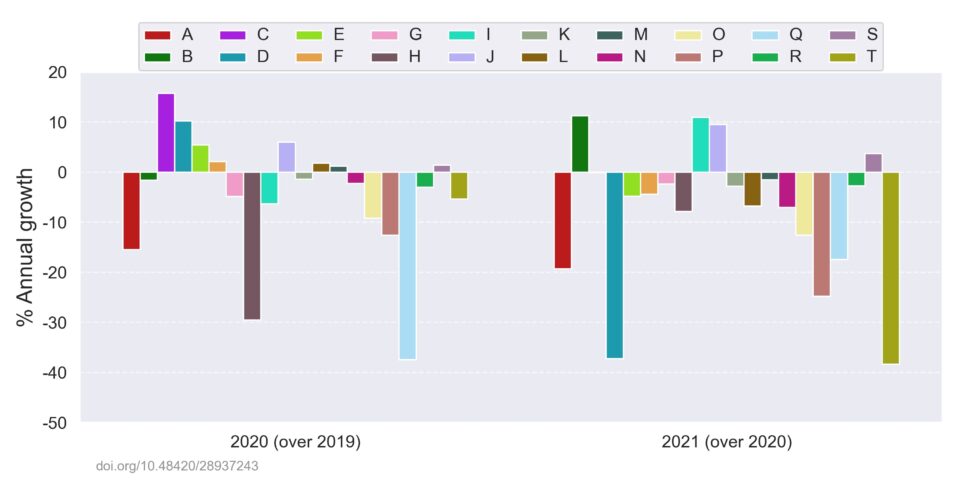
Figure 2 illustrates the annual growth rate of GVA per hour by sector for the UK. During the pandemic, the sectors most impacted by the restrictions imposed due to COVID-19 were Human health and social work activities (Q)(-37.5%), Transportation and storage (H)(-29.5%), Agriculture, forestry and fishing (A)(-15.5%), and Education (P)(-12.6%). A delayed negative effect on productivity growth is observed during 2021 in Activities of households as employers; undifferentiated goods- and services-producing activities of households for own use (T)(-38.3%), Electricity, gas, steam and air conditioning supply(D)(-37.3%), Education (P)(-24.8%) and Agriculture, forestry and fishing (A)(-19.3%).
Figure 2. Sectoral decomposition of the Gross Value Added (GVA) per hour 1 year growth rates for the UK. Data covers the period post-pandemic (2020-2021). Growth rates are computed using log increments. Source: The Productivity Institute with data from EUKLEMS & INTANProd. For more details on the sector decomposition, see Bontadini et al. (2023).
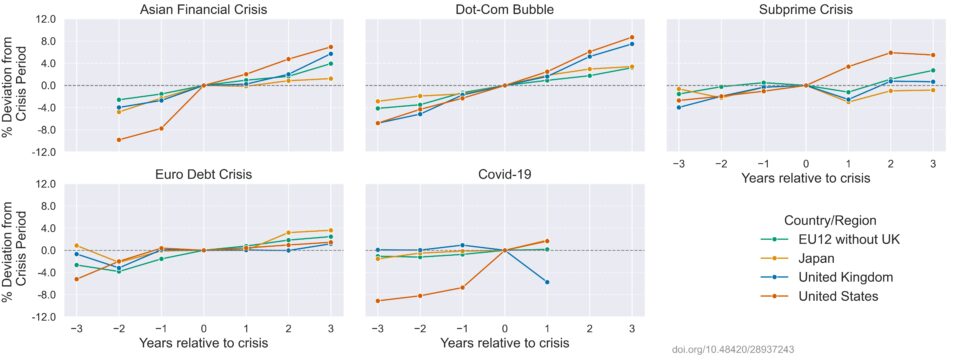
While headline figures highlight recent productivity trends, it is also valuable to examine past episodes of economic stress. The EUKLEMS & INTANProd database includes a rich time dimension starting in 1995. We leverage this feature to dig deeper and examine the impact of productivity growth trends around crises, such as the Asian crisis (1997), the Dot-com bubble (2001), the Sub-prime crisis (2008) and the Euro debt crisis (2011), along with COVID-19 for comparison. We then proceed to calculate the growth rates 3 years[1] before and after the year of economic turmoil. To ensure all figures are comparable, we use real GVA per hour to adjust for inflationary effects and use the year of the crisis as a base.
Figure 3 below illustrates the recovery process around crises for the four economic blocs in our study. Although there have been different triggers for each crisis, results show a clear recovery trend across all four economic blocs after each episode. The magnitude of recovery varies, with the US standing out in almost all cases except for the Euro crisis, where it was within the overall trend. In addition, the UK has shown comparable recovery rates in the past relative to Japan and the European Union EU-11 economic bloc. Similar to the Subprime crisis, which took two years to return to pre-crisis levels, the UK’s labour productivity growth bounced back in 2022 after the global COVID-19 pandemic, which adds to the resilience of the UK economy despite the challenging circumstances.
Figure 3. Real Labour Productivity growth during different scenarios of market stress. Labour productivity is measured by GVA per hour and adjusted for inflation. Growth rates are calculated as annual log-differences, then normalised by the GVA per hour value observed in the year of the crisis. Values are reported in percentage points (e.g., 0.5 = 0.5%). Data covers the period 1995-2021. Source: The Productivity Institute, based on data from EUKLEMS & INTANProd.
The role of Intangible Capital in modern productivity
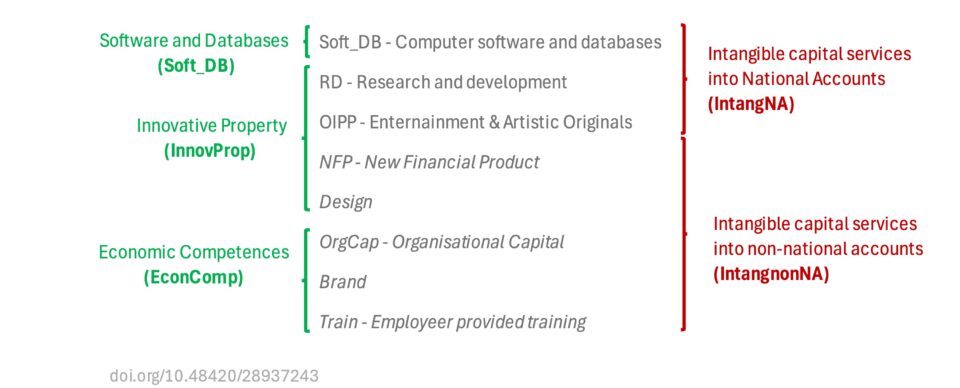
One of the key strengths of the EUKLEMS & INTANProd database is its comprehensive information on Intangible Capital, which fully integrates all intangible assets as originally identified by Corrado, Hulten and Sichel (2005, 2009). The overall decomposition is shown below.
Figure 4: Capital decomposition in EUKLEMS & INTANprod analytical module. Source: Bontadini et al. (2023)
Among the components of Capital and investment (i.e. Gross Fixed Capital Formation or GFCF), the categories (i) Computer software and databases, (ii) Research and development, and (iii) Entertainment and Artistic Originals are contained in the official statistics and are commonly used as proxies of Intangible Capital. In this regard, the EUKLEMS & INTANProd adds to the wealth of information by including data on Intangible Capital not recognised as investment in the official statistics. These additional categories include:
- Attributed design
- Brand and market research
- Organisational capital (operating models)
- New financial products
- Firm-specific human capital (training)
Each intangible asset is measured through (i) Purchased components, whose primary source is the Supply and Use Tables (SUTs) from the national accounts, and (ii) Own-Account (OA) components, which are constructed from survey data on employment and compensation by occupation and industry[2]. This hybrid approach allows for the identification of the economic value developed internally at firms beyond the information obtained from official statistics.
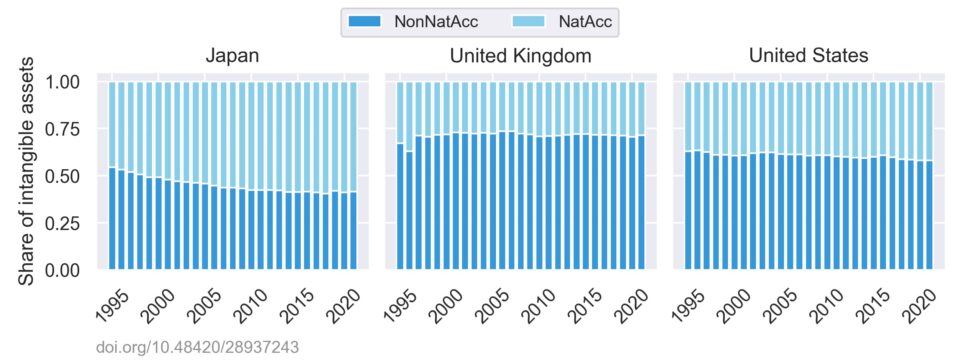
The categorisation above enables the examination of the proportions of Total Intangible Assets that partly originate from National Accounts and from alternative sources not included in the official statistics. Across the board, more than half of the total value of intangible assets comes from sources other than national accounts. Thus, the added value of the granularity of the intangible capital dimension from the EUKLEMS & INTANProd dataset becomes relevant in providing a more comprehensive picture of the actual value of intangible assets beyond the official statistics.
Figure 5. Share of Total Intangible Assets (I_Intang) that comes from National Accounts (NatAcc) and from Non-National Accounts (NonNatAcc) over time. Each share is calculated based on the definitions of Bontadini et al. (2023). Source: The Productivity Institute with data from EUKLEMS & INTANProd.
The contribution of capital to value added and labour productivity
Bontadini et al. (2023) include the contribution of capital services to value added and labour productivity growth across three main groups of assets: tangible non-ICT (e.g. structures, administrative and operational equipment), tangible ICT (e.g. computers, smartphones, and telecom hardware) and intangibles (software & databases, innovative property, and economic competencies). This breakdown results in the decomposition depicted in the diagram below[3].
Figure 6. Labour Productivity Growth decomposition. Source Bontadini et al. (2023)
Using this framework, researchers and policymakers can analyse the main drivers of growth in value added and/or labour productivity. The richness of the EUKLEMS & INTANProd database allows researchers to decompose the overall growth rate into its components as described in the capital growth equation from Bontadini et al. (2023). Figure 7 below depicts the annual growth rates of labour productivity per hour in the United Kingdom since 1995. The data allows us to understand which components explain the overall growth and how their relevance evolves over time. For example, we observe highly volatile growth rates since 2017, following a period of stagnation in growth that began in 2012. Additionally, we can see the contribution of intangibles to total growth increasing post COVID-19 pandemic.
Figure 7. Decomposition of 1 year labour productivity growth per hour of the UK. Decomposition of labour productivity growth is calculated as shown in Eq. (16) of Bontadini et al. (2023) using the Total NACE industries. Growth rates are computed using log-increments. For more details on variable definitions, see Bontadini et al. (2023). Source: The Productivity Institute with data from EUKLEMS & INTANProd.
Discussion
The EUKLEMS & INTANProd database is a vital data tool for analysing productivity trends across various economies. It provides a detailed view of capital growth at both sectoral and national levels. The latest update in January 2025 enhances its significance by expanding estimates of Intangible Capital, which plays a crucial role in contemporary economic growth.
Our analysis reveals some key insights derived from the EUKLEMS & INTANProd database. For example, we show significant differences in productivity trends, notably the US’s leading position in long-term growth, the varying pace of post-pandemic recovery among different regions, and the increasing impact of intangible investments. These findings underscore the importance of ongoing research into the fundamental global and country-specific factors that drive productivity, particularly in relation to policy and investment approaches.
Utilising EUKLEMS & INTANProd data for more in-depth cross-country comparisons and industry-specific analyses could greatly benefit researchers and policymakers. As economies shift towards knowledge-driven frameworks, resources such as EUKLEMS will be essential in guiding decisions that influence future productivity and economic growth (see, for example, van Ark et al. 2024).
Despite these benefits, data availability poses certain limitations. For example, the Labour Costs and Total Factor Productivity components of Labour Productivity (Figure 7) are not currently available after 2008. Similarly, the shares of total intangible assets (Figure 5) cannot be constructed for the EU11 economic bloc due to missing values of some of its components at country level. Although the authors attempt to be as consistent as possible, methodological differences and report practices across countries pose a significant challenge. These issues also make it difficult to expand the scope to sub-national accounts. Nevertheless, the EUKLEMS & INTANprod database adds to the research efforts in understanding productivity using more comprehensive data sources that complement traditional sources, such as national accounts, to better capture the economic value of productivity drivers at the national or macro-national levels.
For more information on productivity data and other related data tools, visit the TPI Productivity Lab website.
Bibliography
- Bontadini, F. et al. (2023) ‘EUKLEMS & INTANProd: industry productivity accounts with intangibles’
- Corrado, C. et al. (2022) ‘Intangible Capital and Modern Economies’, Journal of Economic Perspectives, 36(3), pp. 3–28.
- Corrado, C. et al. (2024) ‘Data, Intangible Capital, and Productivity’.
- Corrado, C., Hulten, C. and Sichel, D. (2009) ‘Intangible Capital and the US Economic Growth, Review of Income and Wealth, 55(3), pp. 661–685.
[1]For the Asian crisis (1997) and the Covid-19 (2020), we display available data
[2] See Table 2 of Bontadini et al. (2023) for a detailed description by asset type
[3] The decomposition for value added growth uses the same components, but with a different naming convention , i.e. VA_G, VAConIntang, etc.


