Comparing productivity performance across the UK using scorecard maps
An example of a productivity driver represented across the UK ITL1 regions
Productivity is hard to measure and its drivers are numerous and strongly interrelated. The Productivity Institute’s Productivity Lab has developed a scorecard series, which is comprised of five main regional productivity drivers that need to be analysed:
- Business performance
- Skills and training
- Policy and institutions
- Health and well-being
- Investment and infrastructures.
These five regional productivity drivers are captured using 17 indicators and their past performance is analysed in the short-term (one year) and long-term (five years) to help develop regional strategic initiatives and objectives.
Scorecards
The Scorecards cover the 12 ITL-1 level regions in the UK, encompassing all the regions of England and the devolved nations. They are free to download and use subject to citations:
- London
- South East
- South West
- East of England
- East Midlands
- West Midlands
- Yorkshire and The Humber
- North East
- North West
- Scotland
- Wales
- Northern Ireland
There is also an overview of all the ITL1 regions, along with an annex.
Scorecard maps
The scorecards have now also been converted into maps for each productivity driver, which provide a snapshot of how each region and devolved nation has fared. The maps offer a clear visualisation of the regional aspects of many of these drivers. They are free to download and use subject to citations:
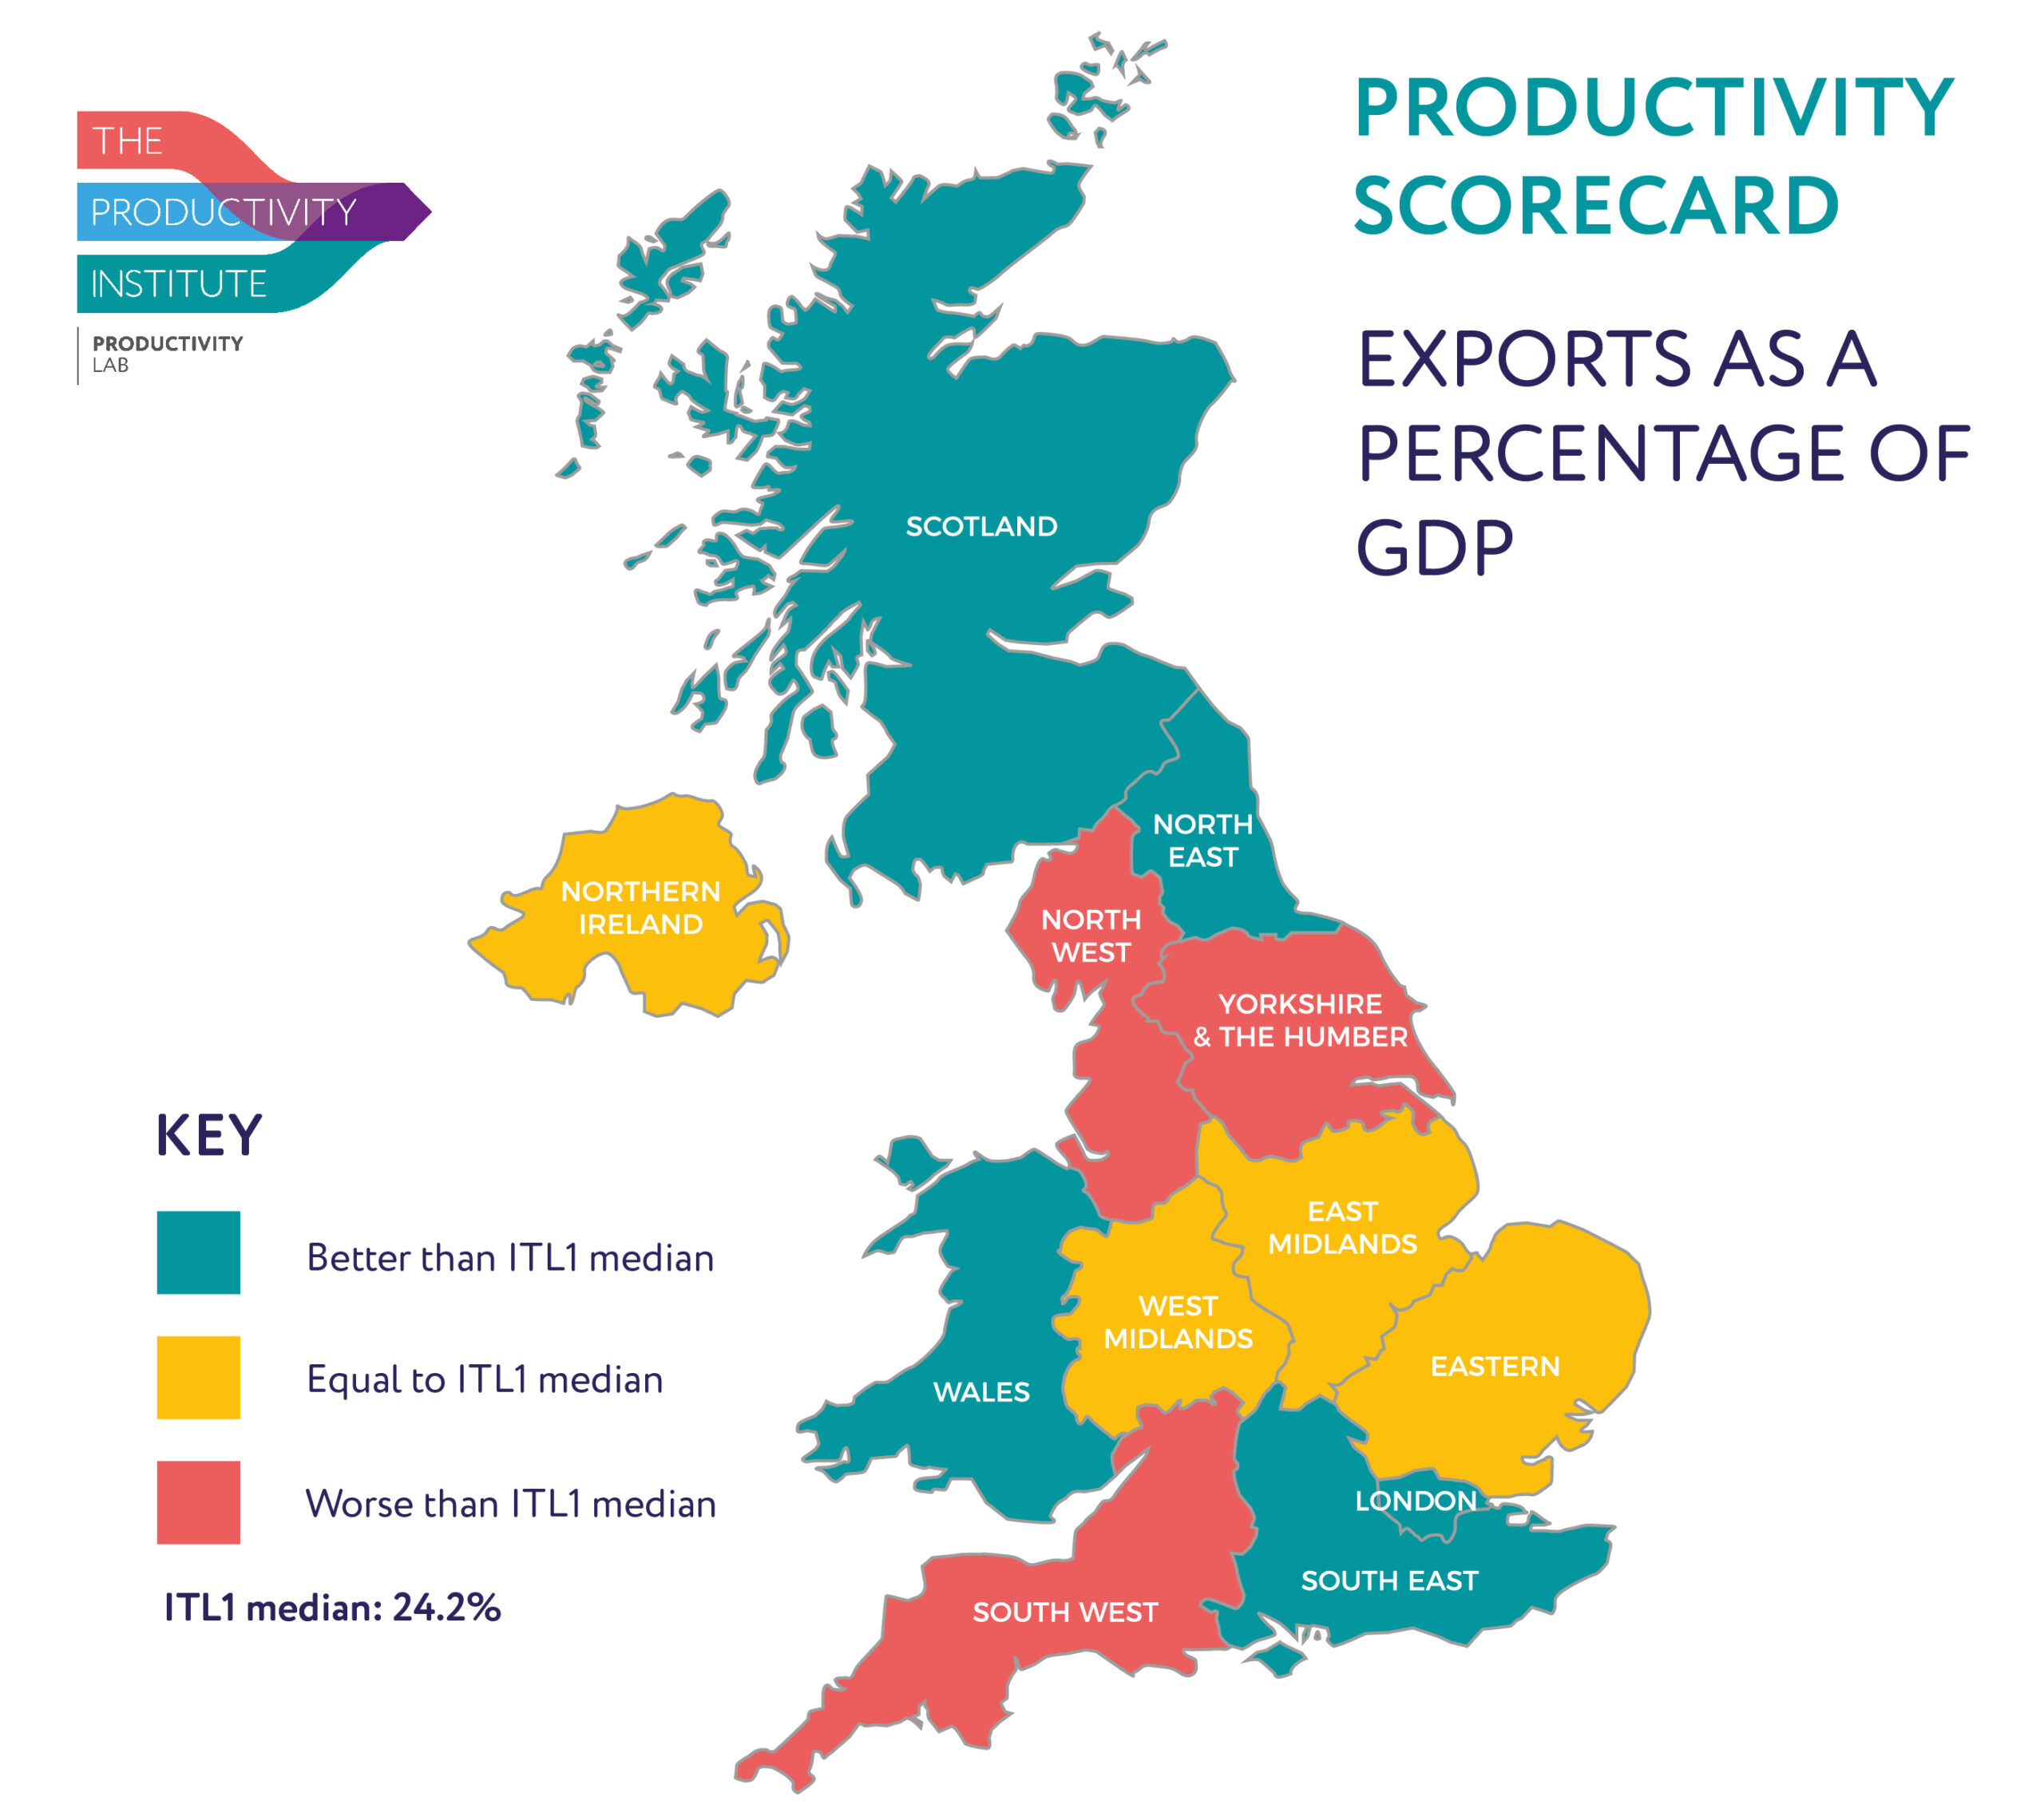
Business performance & characteristics
- Exports as % of GDP
- R&D per job
- Innovation active businesses
- Access to finance as a barrier
- Births of new enterprises
Skills & training
- Highly-skilled population
- Low-skilled population
- Skills development and job-related training
- Skill shortage vacancies
Policy & institutions
Health & well-being
Investment, infrastructure & connectivity
To find out more, read the Productivity Lab’s blog on the scorecards, which goes into detail about how best to use the indicators.


