By Nathan McKeogh, Raquel Ortega- Argilés, William Sarsfield and Ruby Watson
The aims of the Office for National Statistics (ONS) are to provide comparable, high-quality statistics that support policy making and offer meaningful insight into the UK’s economy, society and population. As part of this remit, adjustments to the regional classifications are made periodically to reflect changes in population, distribution, governance structures and local economies. These updates help ensure that regional economic analysis remains relevant, accurate and aligned with real world developments.
The 2025 ONS update to the UK’s International Territorial Levels (ITLs) represent a significant reconfiguration of subnational classifications, specifically at the ITL2 and ITL3 levels, while maintaining the existing ITL1 structure. These revisions are designed to better reflect current areas of economic interest and governance (ONS, 2025). With the redefinition of 179 ITL3 regions into 182 and an increase from 41 to 46 ITL2 regions, these revisions will facilitate easier data collection and analysis. Accordingly, ITL2 boundaries in England have been adjusted, where possible, to align with Combined Authorities led by elected mayors providing a more direct relationship between statistical and legislative geographical units.
Figure 1 below shows UK maps of the changes of ITL3 regions between the 2021 and 2025 classifications.
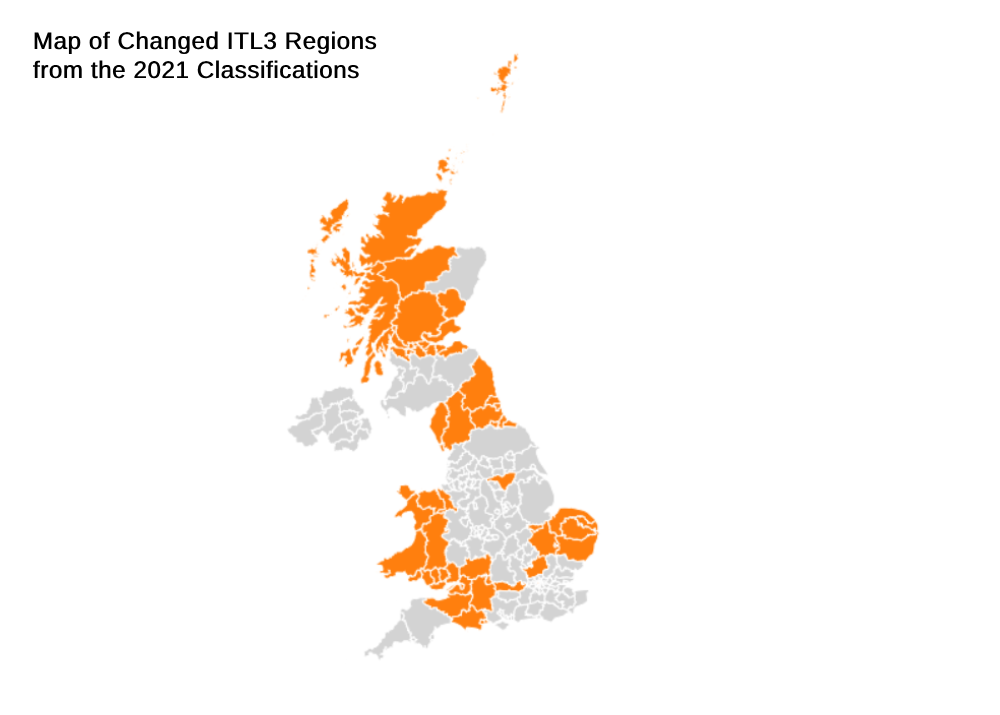
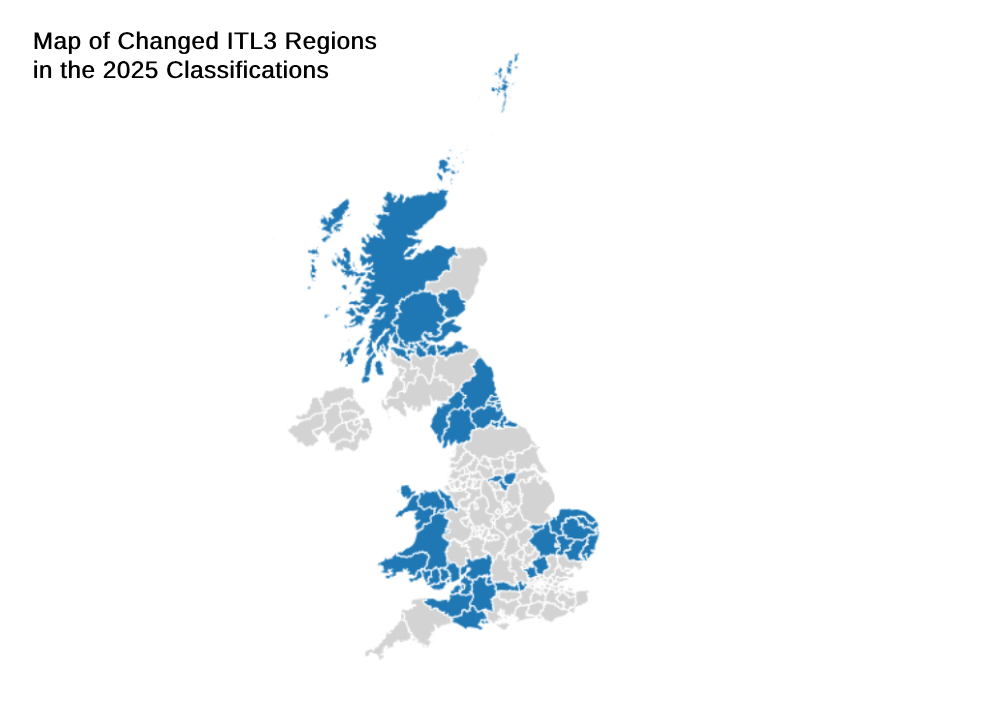
Figure 1: Map of Changed ITL3 regions from the 2021 to the 2025 ITL 3
Similar to Figure 1, Figure 2 shows UK maps but for the changes in ITL2 classifications between 2021 and 2025.
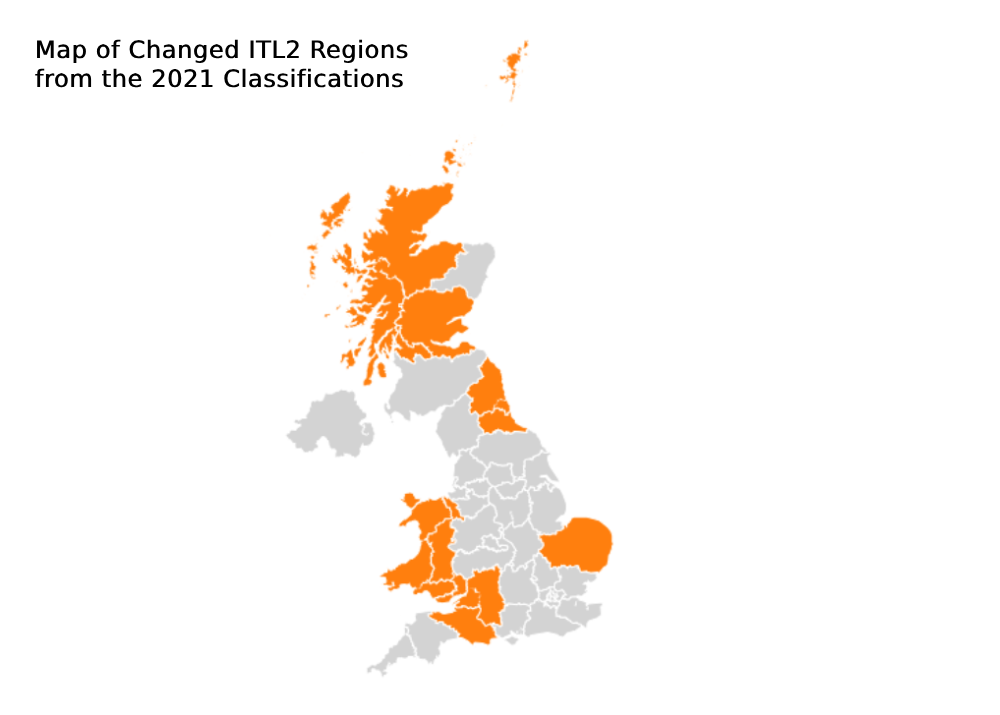
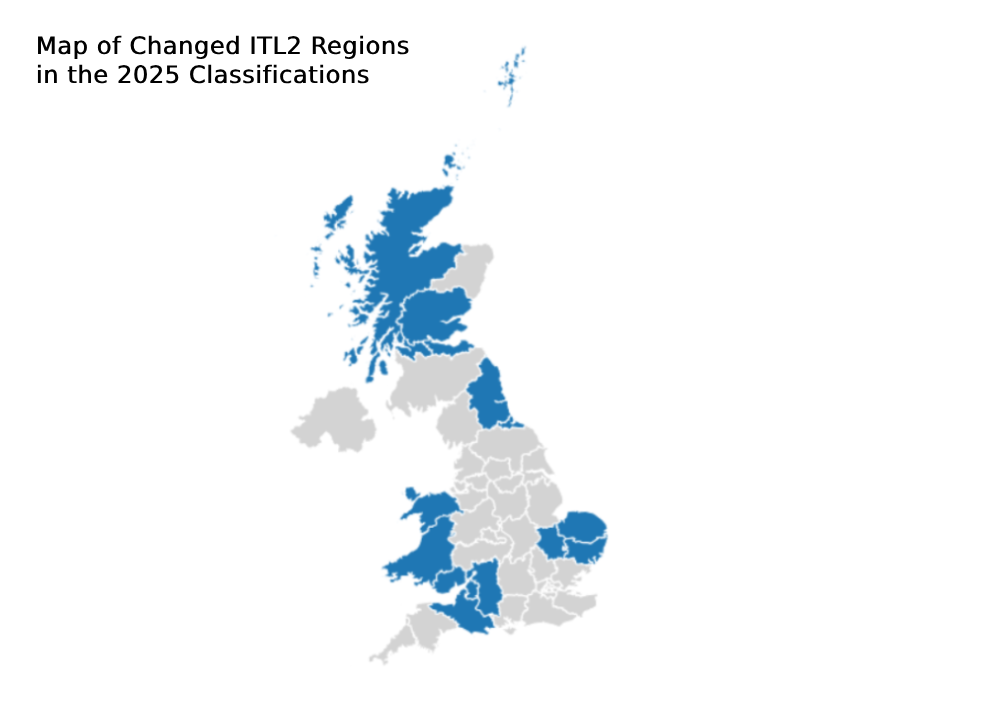
Figure 2: Map of Changed ITL2 regions from the 2021 to the 2025 ITL 2
Aligning ITL regions with local authority boundaries will make producing geographical statistics easier, as regional data can be more readily derived from widely available local authority statistics, whereas ITL statistics are harder to produce when data is not collected at the local level. The advantages of this alignment, particularly in terms of data accessibility and clearer policy relevance, generally outweigh the disadvantages of redefining codes. Changes to ITL boundaries inevitably affect the comparability of data over time. It can become difficult to determine whether differences in statistics reflect real changes or are simply due to the altered geography. However, data can be aggregated from the local authority level to ITL3 to support case time series with the 2025 ITL3 codes. In doing this, however, there may be some discrepancies with regional aggregates from ONS because we do not know how they construct the aggregated regional values.
In Wales, ITL2 regions have been redefined to more equally distribute the population across the country. More balanced populations across ITL regions allow for more meaningful regional comparisons. Additionally, these changes will produce regions that will be better at reflecting differing characteristics of each area.
The updated ITLs are based on a hierarchical structure, where 2024 Local Authority Units (LAUs) are aggregated upwards through ITL3 and ITL2 to ITL1. The 2025 version maintains the same population thresholds used in previous NUTS and ITL frameworks and applies a consistent methodology across UK nations. Changes to ITL boundaries also ensure ongoing compliance with these thresholds.
As stated on ONS, within the UK, three International Territorial Levels (ITL) are determined as follows:
England
- ITL 1: Regions
- ITL 2: Counties, Combined Authorities and groups of counties
- ITL 3: Counties and groups of unitary authorities
Scotland
- ITL 1: Scotland
- ITL 2: Combinations of council areas, and parts thereof
- ITL 3: Combinations of council areas, and parts thereof
Wales
- ITL 1: Wales
- ITL 2: Groups of unitary authorities
- ITL 3: Groups of unitary authorities
Northern Ireland
- ITL 1: Northern Ireland
- ITL 2: Northern Ireland
- ITL 3: Local government districts
Figure 3 maps the ITL 3 region changes coloured by ITL 1 region.
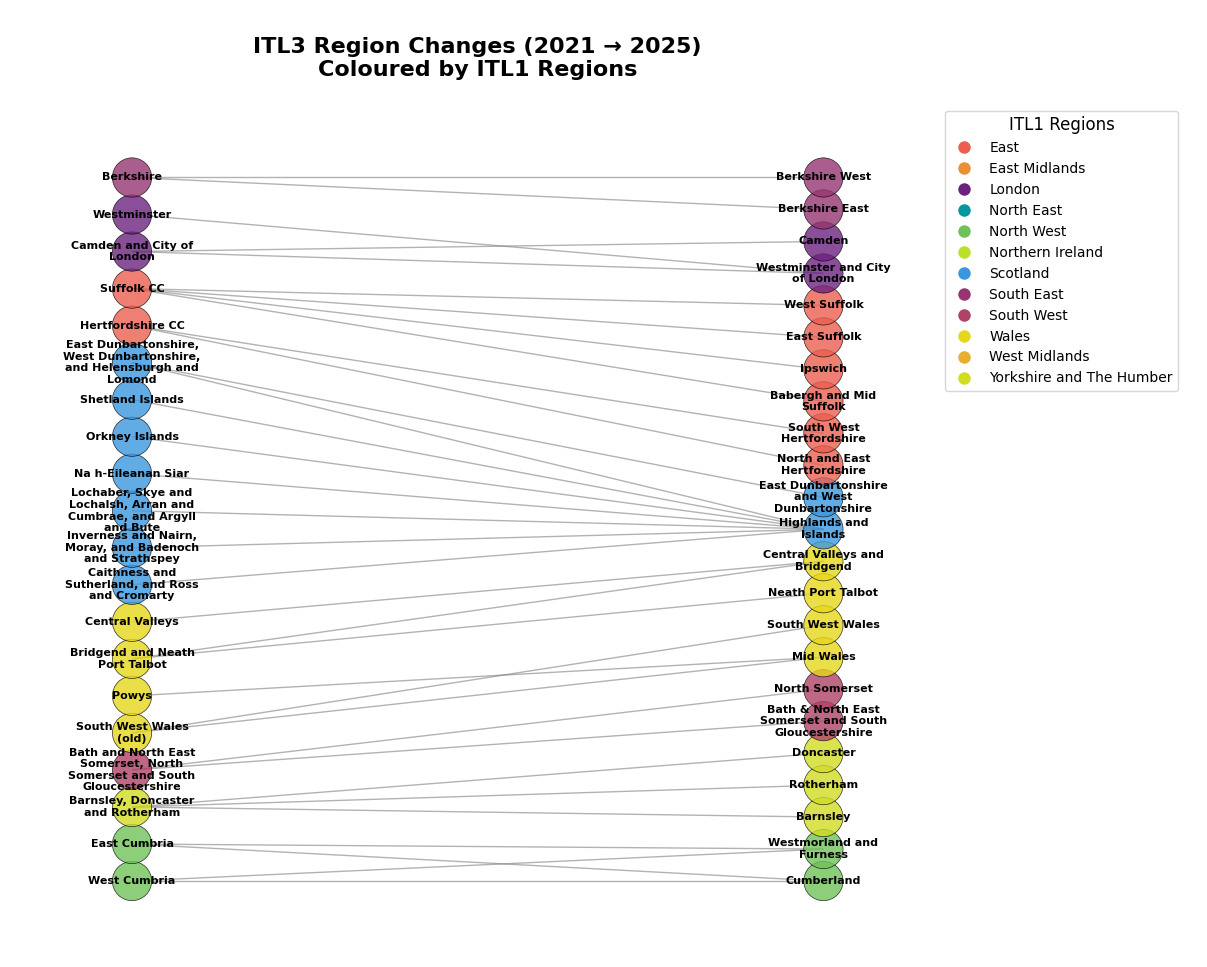
Figure 3: ITL 3 Region Changes (2021 -> 2025) Coloured by ITL1 Regions.
Source: The TPI Productivity Lab’s own elaboration
Figure 4 elaborates upon Figure 2, showing the relationship between the 2021 revision of ITL 3 regions (179) and the 2025 revision of ITL 3 regions (182) through local authorities.
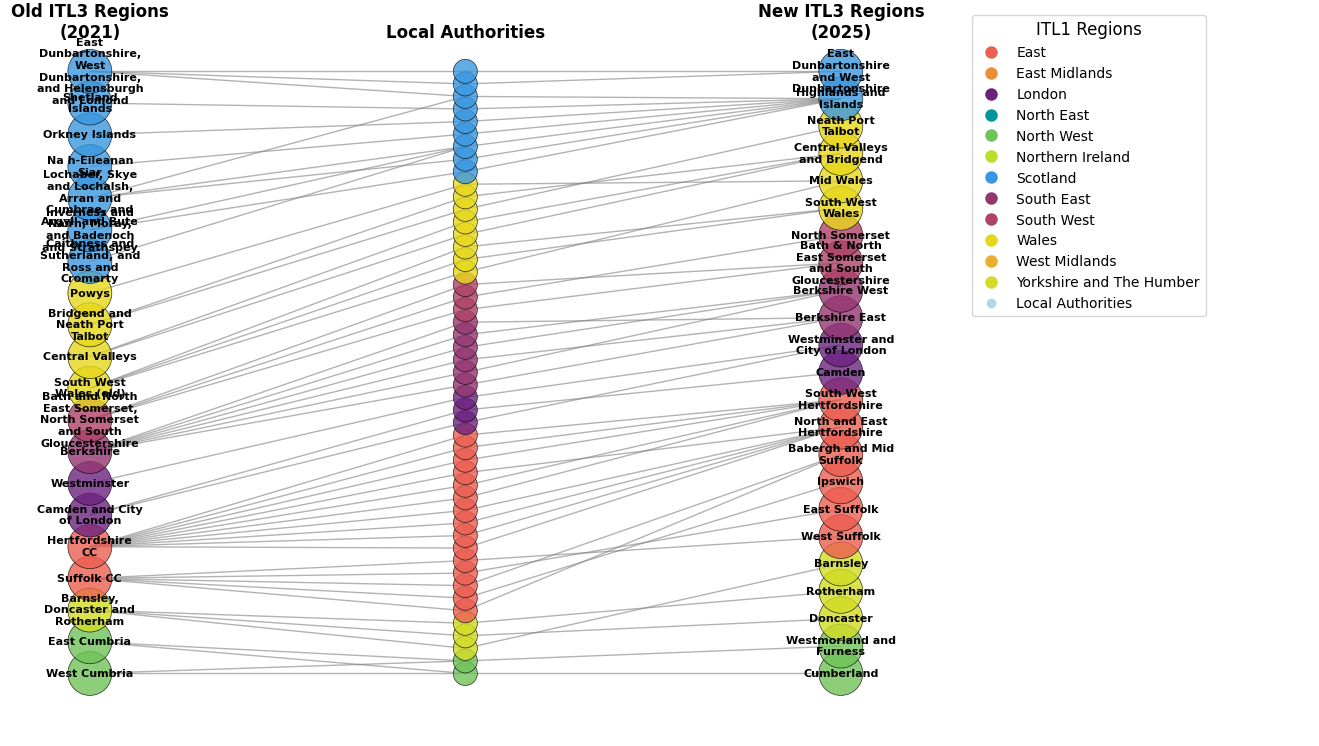
Figure 4: ITL 3 Region Changes (2021 -> 2025) Coloured by ITL1 Regions with local authorities
Source: TPI Productivity Laboratory’s elaboration
The changes to the ITL3 classification have had a direct impact on the TPI Data Lab ITL 3 scorecards, particularly where data for the new ITL3 revised codes has not yet been released. This has created gaps in the scorecards, reducing their effectiveness for regional comparison. This is illustrated below for the 2025 ITL 3 scorecard for the East of England. As a result, there will be a delay in the publication of the ITL3 scorecards while work is carried out to address the identified gaps.
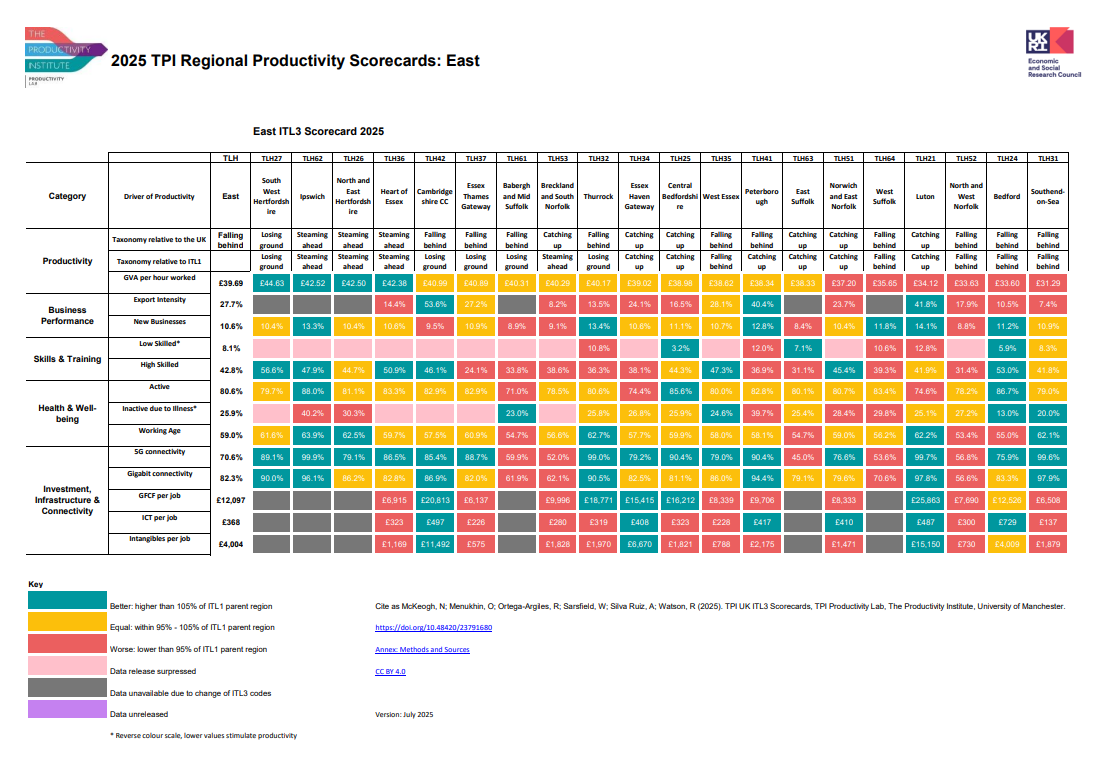
Figure 5: ITL 3 Scorecard for East of England
Reference Links
ONS. 2025. Regional Economic Activity By Gross Domestic Product, UK: 1998 to 2023. Available at: https://backup.ons.gov.uk/wp-content/uploads/sites/3/2025/04/Regional-economic-activity-by-gross-domestic-product-UK-1998-to-2023.pdf
ONSa. n.d. International, regional and city statistics. Available at: https://www.ons.gov.uk/aboutus/whatwedo/programmesandprojects/europeancitystatistics
ONSb. n.d. International Geographies. Available at: https://www.ons.gov.uk/methodology/geography/ukgeographies/eurostat
The Scottish Government. 2024. Changing the International Territorial Level Geography for Scotland: consultation. Available at: https://www.gov.scot/publications/changing-international-territorial-level-geography-scotland-consultation-document/pages/1/