Productivity Measurement Analysis series – UK Q2 2025 by Ruby Watson, Nathan McKeogh and Raquel Ortega-Argilés
General summary and main figures
On 14 August 2025, the Office for National Statistics (ONS) released its flash estimate of the UK productivity for the second quarter of 2025 (April – June). These estimates are based on the quarterly estimates of gross domestic product (GDP) and labour market statistics. The release also includes data for Q1 2025 for sectoral labour productivity.
Labour Force Survey (LFS) estimates indicate output per hour worked increased 1.5% and output per worker increased by 1.1% when compared with pre-pandemic levels. This productivity growth is a result of gross value added (GVA) increasing by 5.1% hours worked increasing by 3.5%.
The estimates reveal UK productivity to be 0.8% lower than Q2 2024, showing continued stagnation in productivity. This was due to hours worked increasing by 2% while GVA increased by 1.1%
Table 1: Flash estimates of labour productivity. UK Quarter 1 (Jan to Mar) 2024 to Q1 2025
| Output per hour growth rates | Output per worker growth rates | |||||
| Quarter vs 2019 level (%) |
Quarter-on- year ago (%) |
Quarter-on- quarter (%) |
Quarter vs 2019 level (%) |
Quarter-on- year ago (%) |
Quarter-on- quarter (%) |
|
| Period | ||||||
| 2024 Q2 | 2.3 | -0.5 | 0.0 | 2.1 | 0.7 | 0.0 |
| 2024 Q3 | 1.1 | -2.1 | -1.2 | 1.3 | -0.1 | -0.8 |
| 2024 Q4 | 1.9 | -0.5 | 0.7 | 1.1 | 0.0 | -0.2 |
| 2025 Q1 | 2.2 | -0.2 | 0.3 | 1.5 | -0.7 | 0.4 |
| 2025 Q2 | 1.5 | -0.8 | -0.6 | 1.1 | -1.0 | -0.4 |
Sectoral contributions for Q1 2025
In terms of sectoral contribution, consistent with Q4 2024, the Information Technology (IT) and construction industries were the biggest drivers of productivity growth with the largest upwards contributions compared to 2019 (average level).
The substantial growth seen in the construction industry (1.20%) was a result of a decrease in the number of hours worked coupled with an increase in GVA, meaning output per hour improved. Compared to 2019, the IT industry growth (1.25%) has been associated with an increase in GVA. It has continued its strong upward trajectory benefiting from advancements in AI, cloud computing, and digital services. Other sectors, such as Administrative and support services activities or Professional, scientific and technical activities have seen a surge in productivity as remote work and digital transformation have become more widespread. Output per hour in manufacturing showed slight positive growth, suggesting modest efficiency gains. In contrast, over the same period, the health industry made the largest negative contribution (1.42%).
Retail and hospitality in 2019 had stable productivity levels. However, the pandemic-induced shifts in consumer behaviour and labour shortages have led to slower recovery, with businesses adapting through automation and streamlined operations. Wholesale and retail productivity growth remains quite low, indicating stability but not significant improvements.
In order to illustrate these effects, two figures are provided. Figure 1 shows the contribution to output per hour (OPH) growth by industry, with bar widths scaled by the relative size of the industry. Most contracting industries reduced OPH contribution by around 0.2% but human health and social work activities plunged by 1.4%. Among expanding sectors, manufacturing; administration and support service activities; and professional, scientific and technical activities each contributed about 0.7%. Overall, expansion ranged from 0.1% to 1.3 %. Figure 2 illustrates the industry breakdown in terms of output per hour worked, GVA and hours worked changes in 2024 compared to 2019.
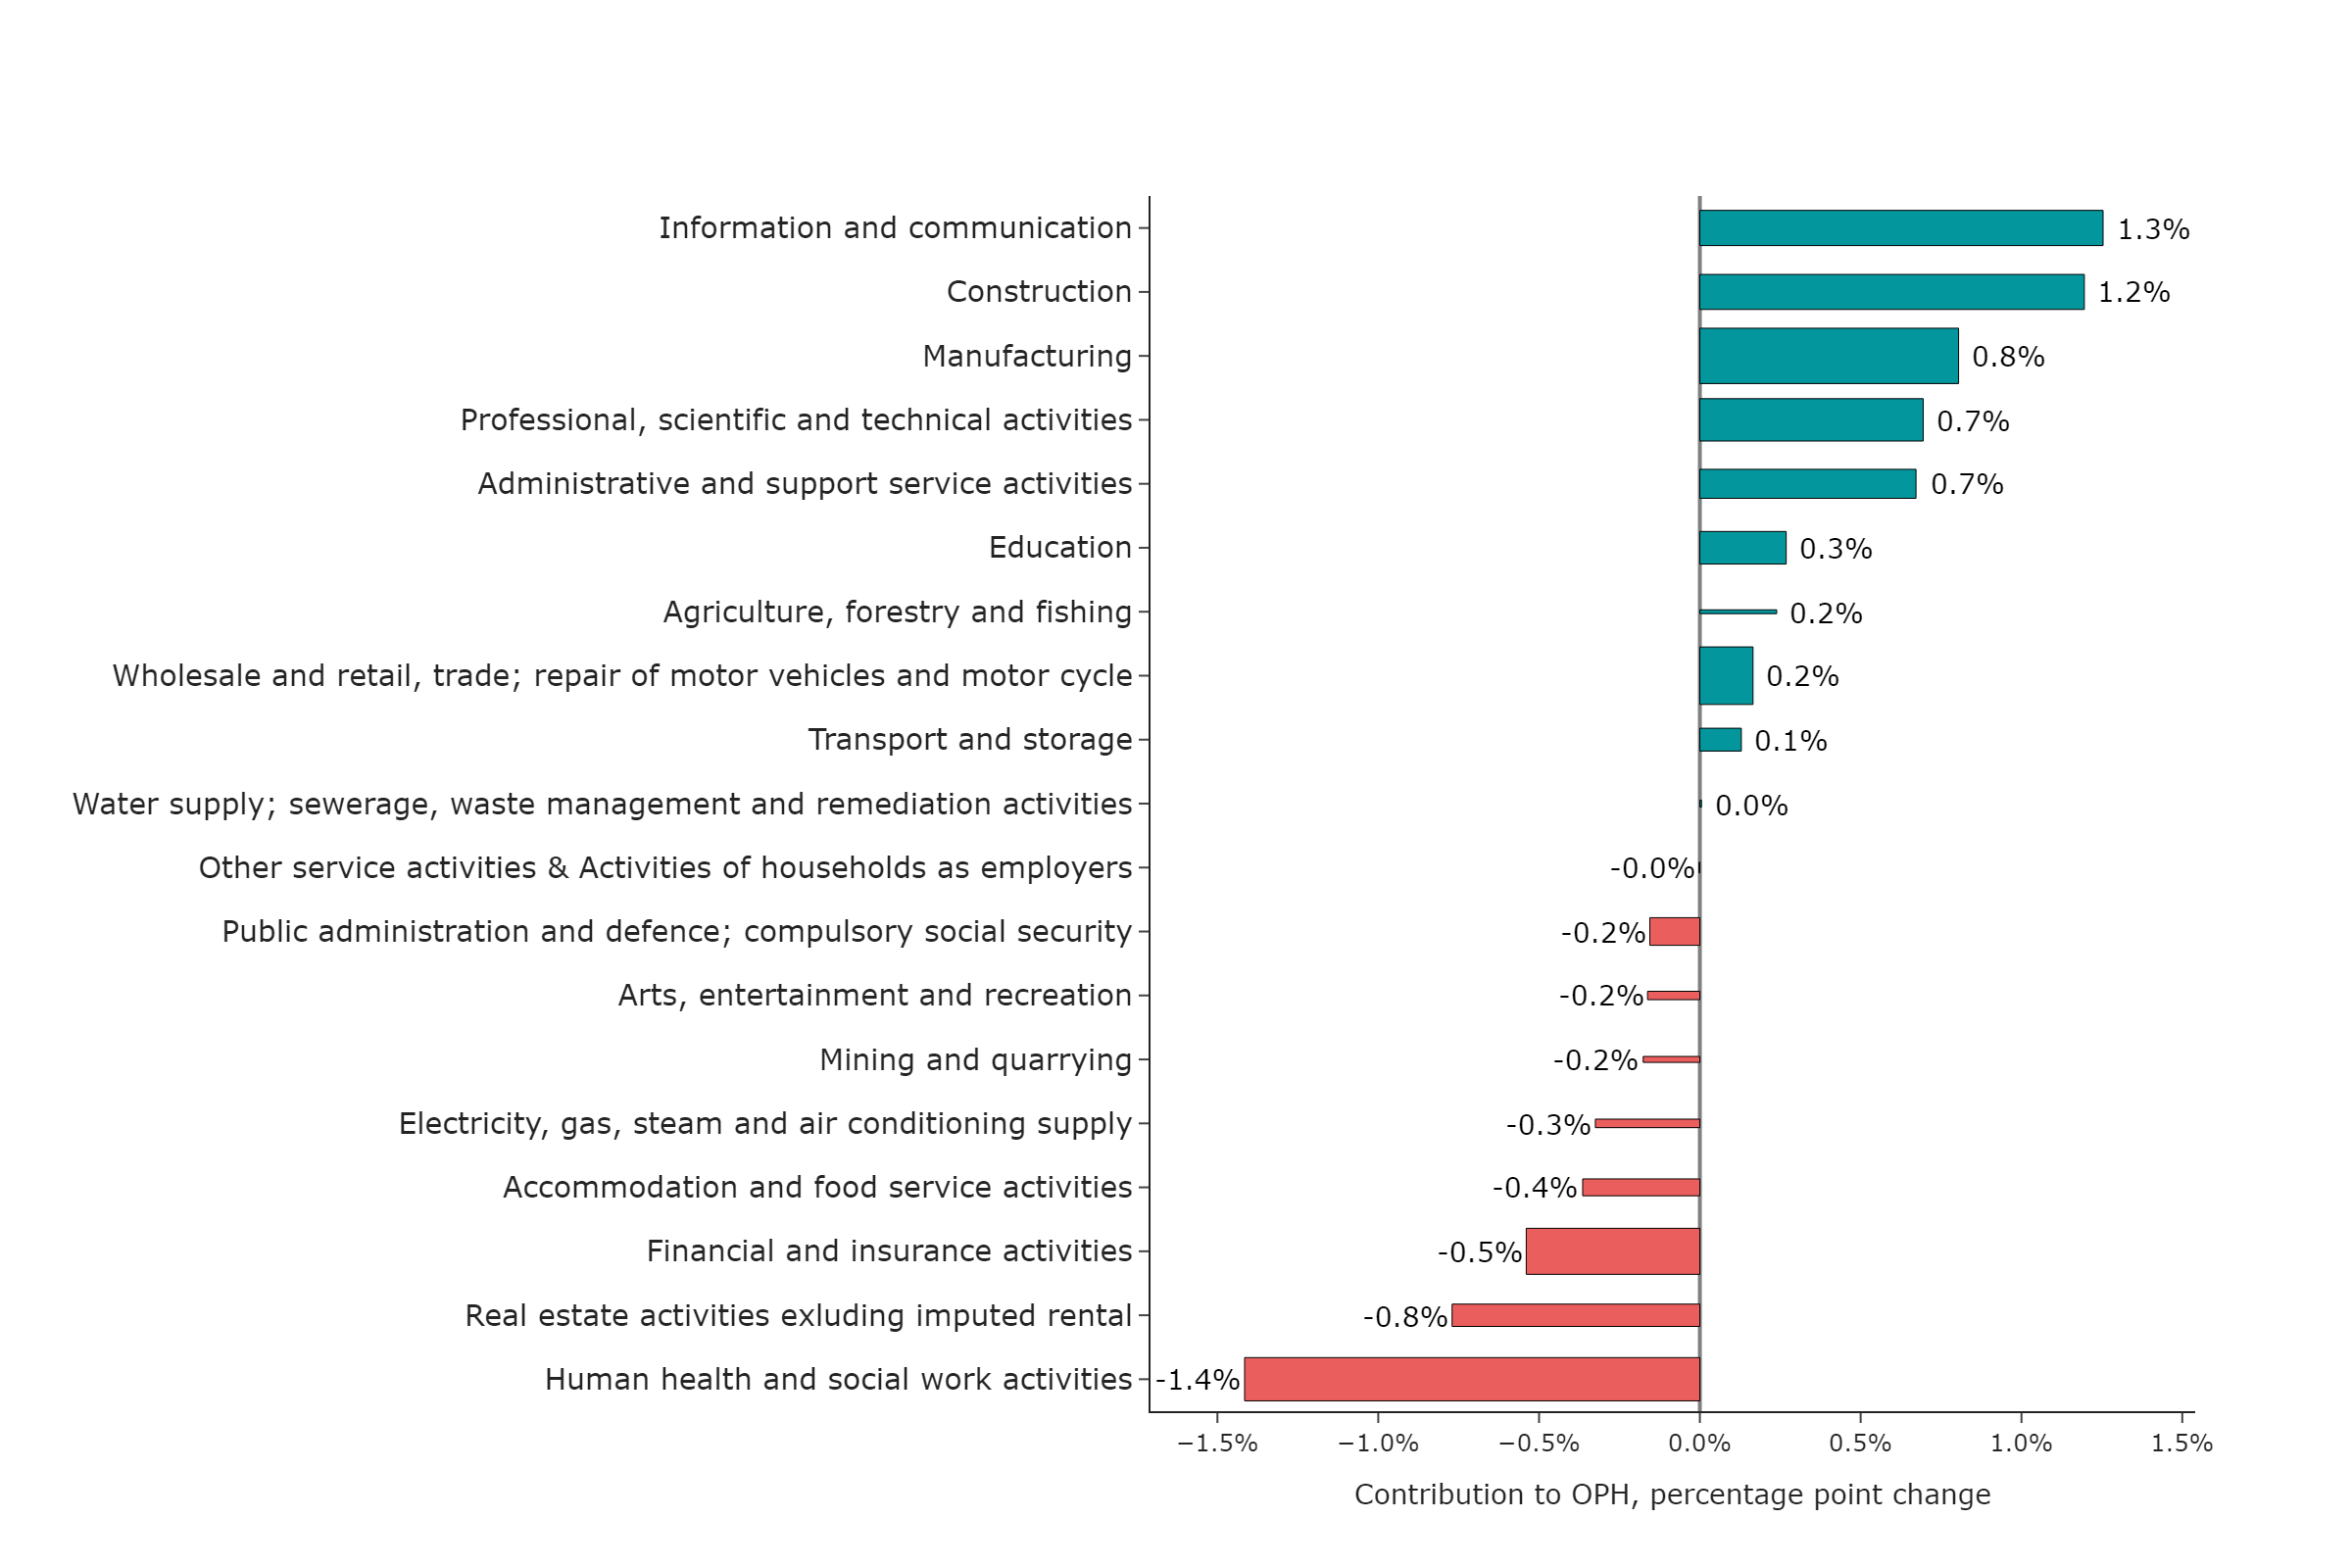
Figure 1: Contribution to growth of output per hour worked by industry, percentage points, Q1 2025 compared with 2019 average, with width of the bar representing relative size of industry. Data Source: Office of National Statistics, Own elaboration by TPI Productivity Lab
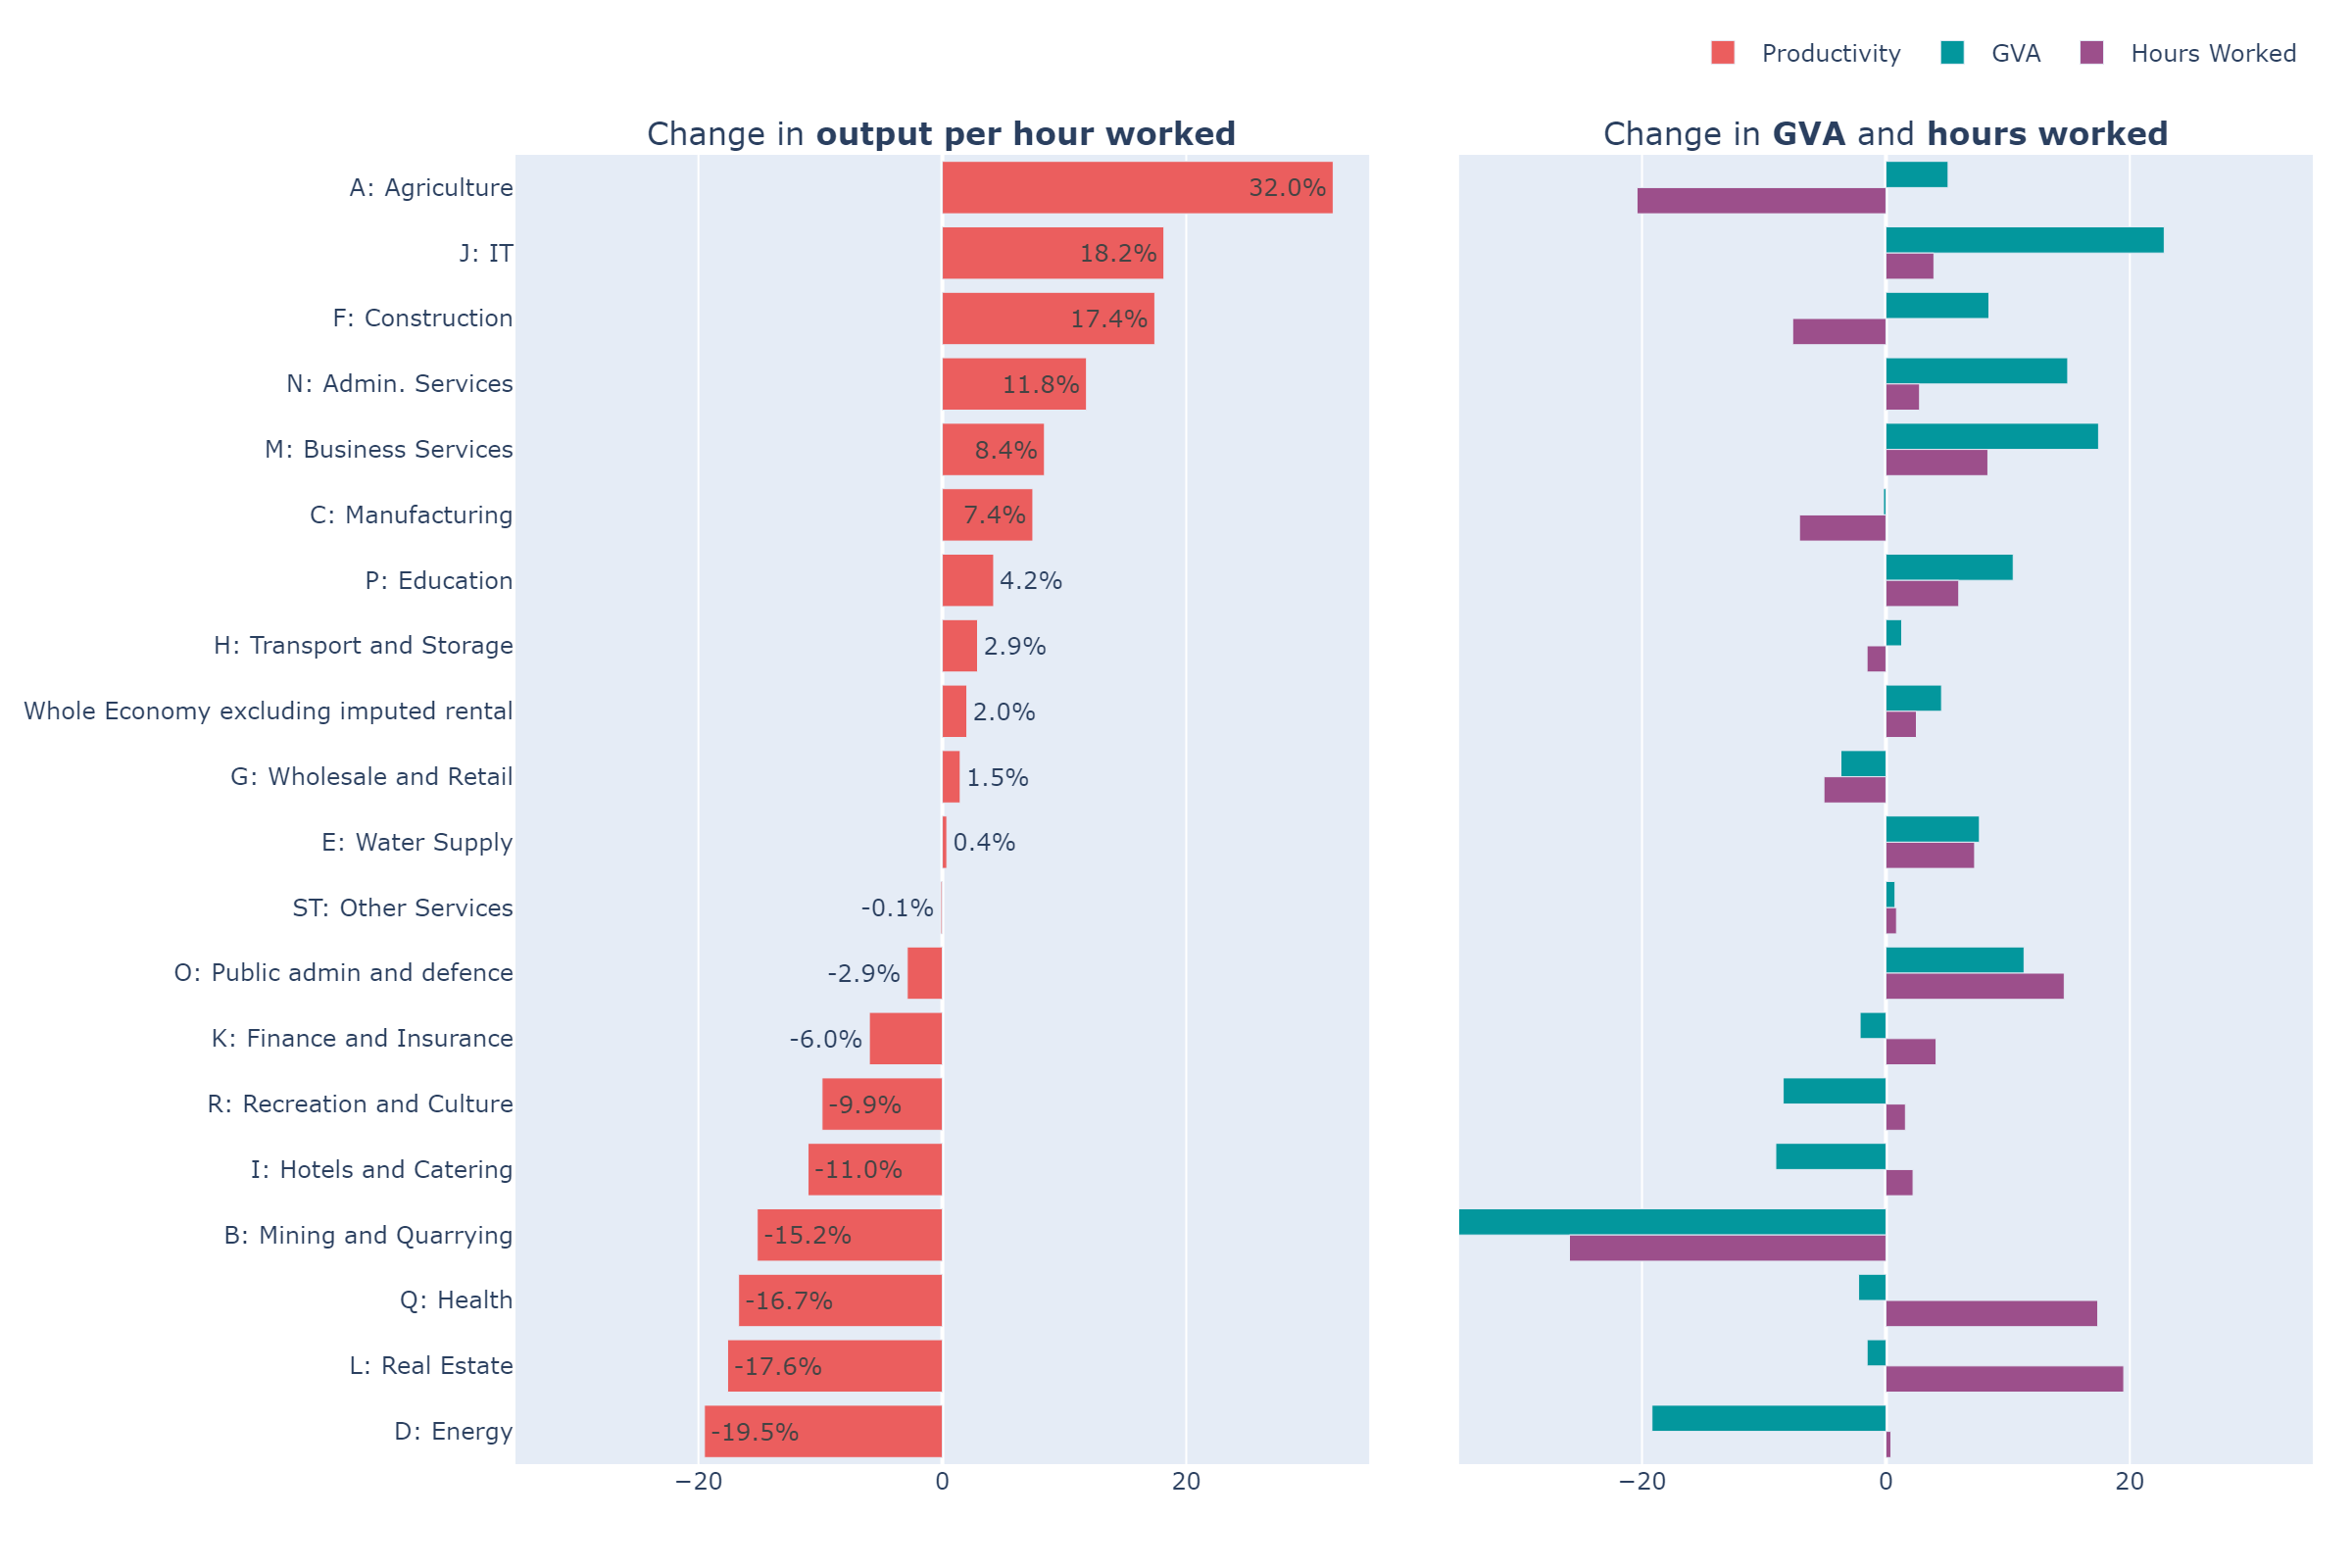
Figure 2: Industry Breakdown: Output per Hour, GVA and Hours worked changes, Q1 2025 compared with 2019 average. Data Source: Office of National Statistics, TPI Productivity Lab reproduction of Office of National Statistics figure
These trends highlight how shifts in labour allocation and industry-specific dynamics shape overall productivity. The estimates show a clear between-industry effect with an economic shift towards lower-productivity industries, resulting in a negative re-allocation effective for the fifth consecutive quarter. This shift is significant as it indicates a change in the composition of the economy, which can have implications for overall productivity.
The sectoral decomposition effects play a key role in influencing economic policy, as it highlights which industries drive productivity growth and which may require policy intervention. Some potential implications of these figures may emphasise the momentum in investment in high-growth sectors such as construction through infrastructure investment or innovation and technological funding. Digital adoption incentives and supply chain optimisations in wholesale and productivity or optimising workforce allocation in healthcare may be targeted measures to consider for improving sectoral efficiency is the less productive sectors.
Experimental methods
As indicated in the latest ONS release on productivity trends, experimental methods can be used to generate estimates. This includes incorporating Pay As You Earn (PAYE) Real Time Information (RTI) and LFS data sources. RTI data is only available from Q3 2014 onwards. RTI does not include information on self-employment (SE), therefore LFS self-employment data is appended to RTI data to produce more accurate and comparable estimates.
No adjustment is made for those that are employed but not part of PAYE. Using LFS for self-employed risks double counting, so to address this, working proprietors are removed. Working proprietors make up 10% of all self-employed workers and can be understood as self- employed individuals who are employees of their own firm.
Since these methods are experimental, results from these data sources should be used with caution. Compared to the 1.1% growth seen in output per worker using the LFS, RTI data sources indicate a growth of 2.5%. With the LFS, output per hour saw a 1.5% growth but a 2.9% growth using RTI. These results suggest consistency in the trends over the long term. Comparisons have been illustrated below in Figure 3 and Figure 4. Figure 3 and Figure 4 show the periods of Q1 2015 to Q1 2019 and Q3 2021 to Q2 2025 side by side. The intermediate period of Q2 2019 to Q2 2021 has been omitted to highlight the differences between the LFS and RTI + SE results without the distorting effects of COVID-19.
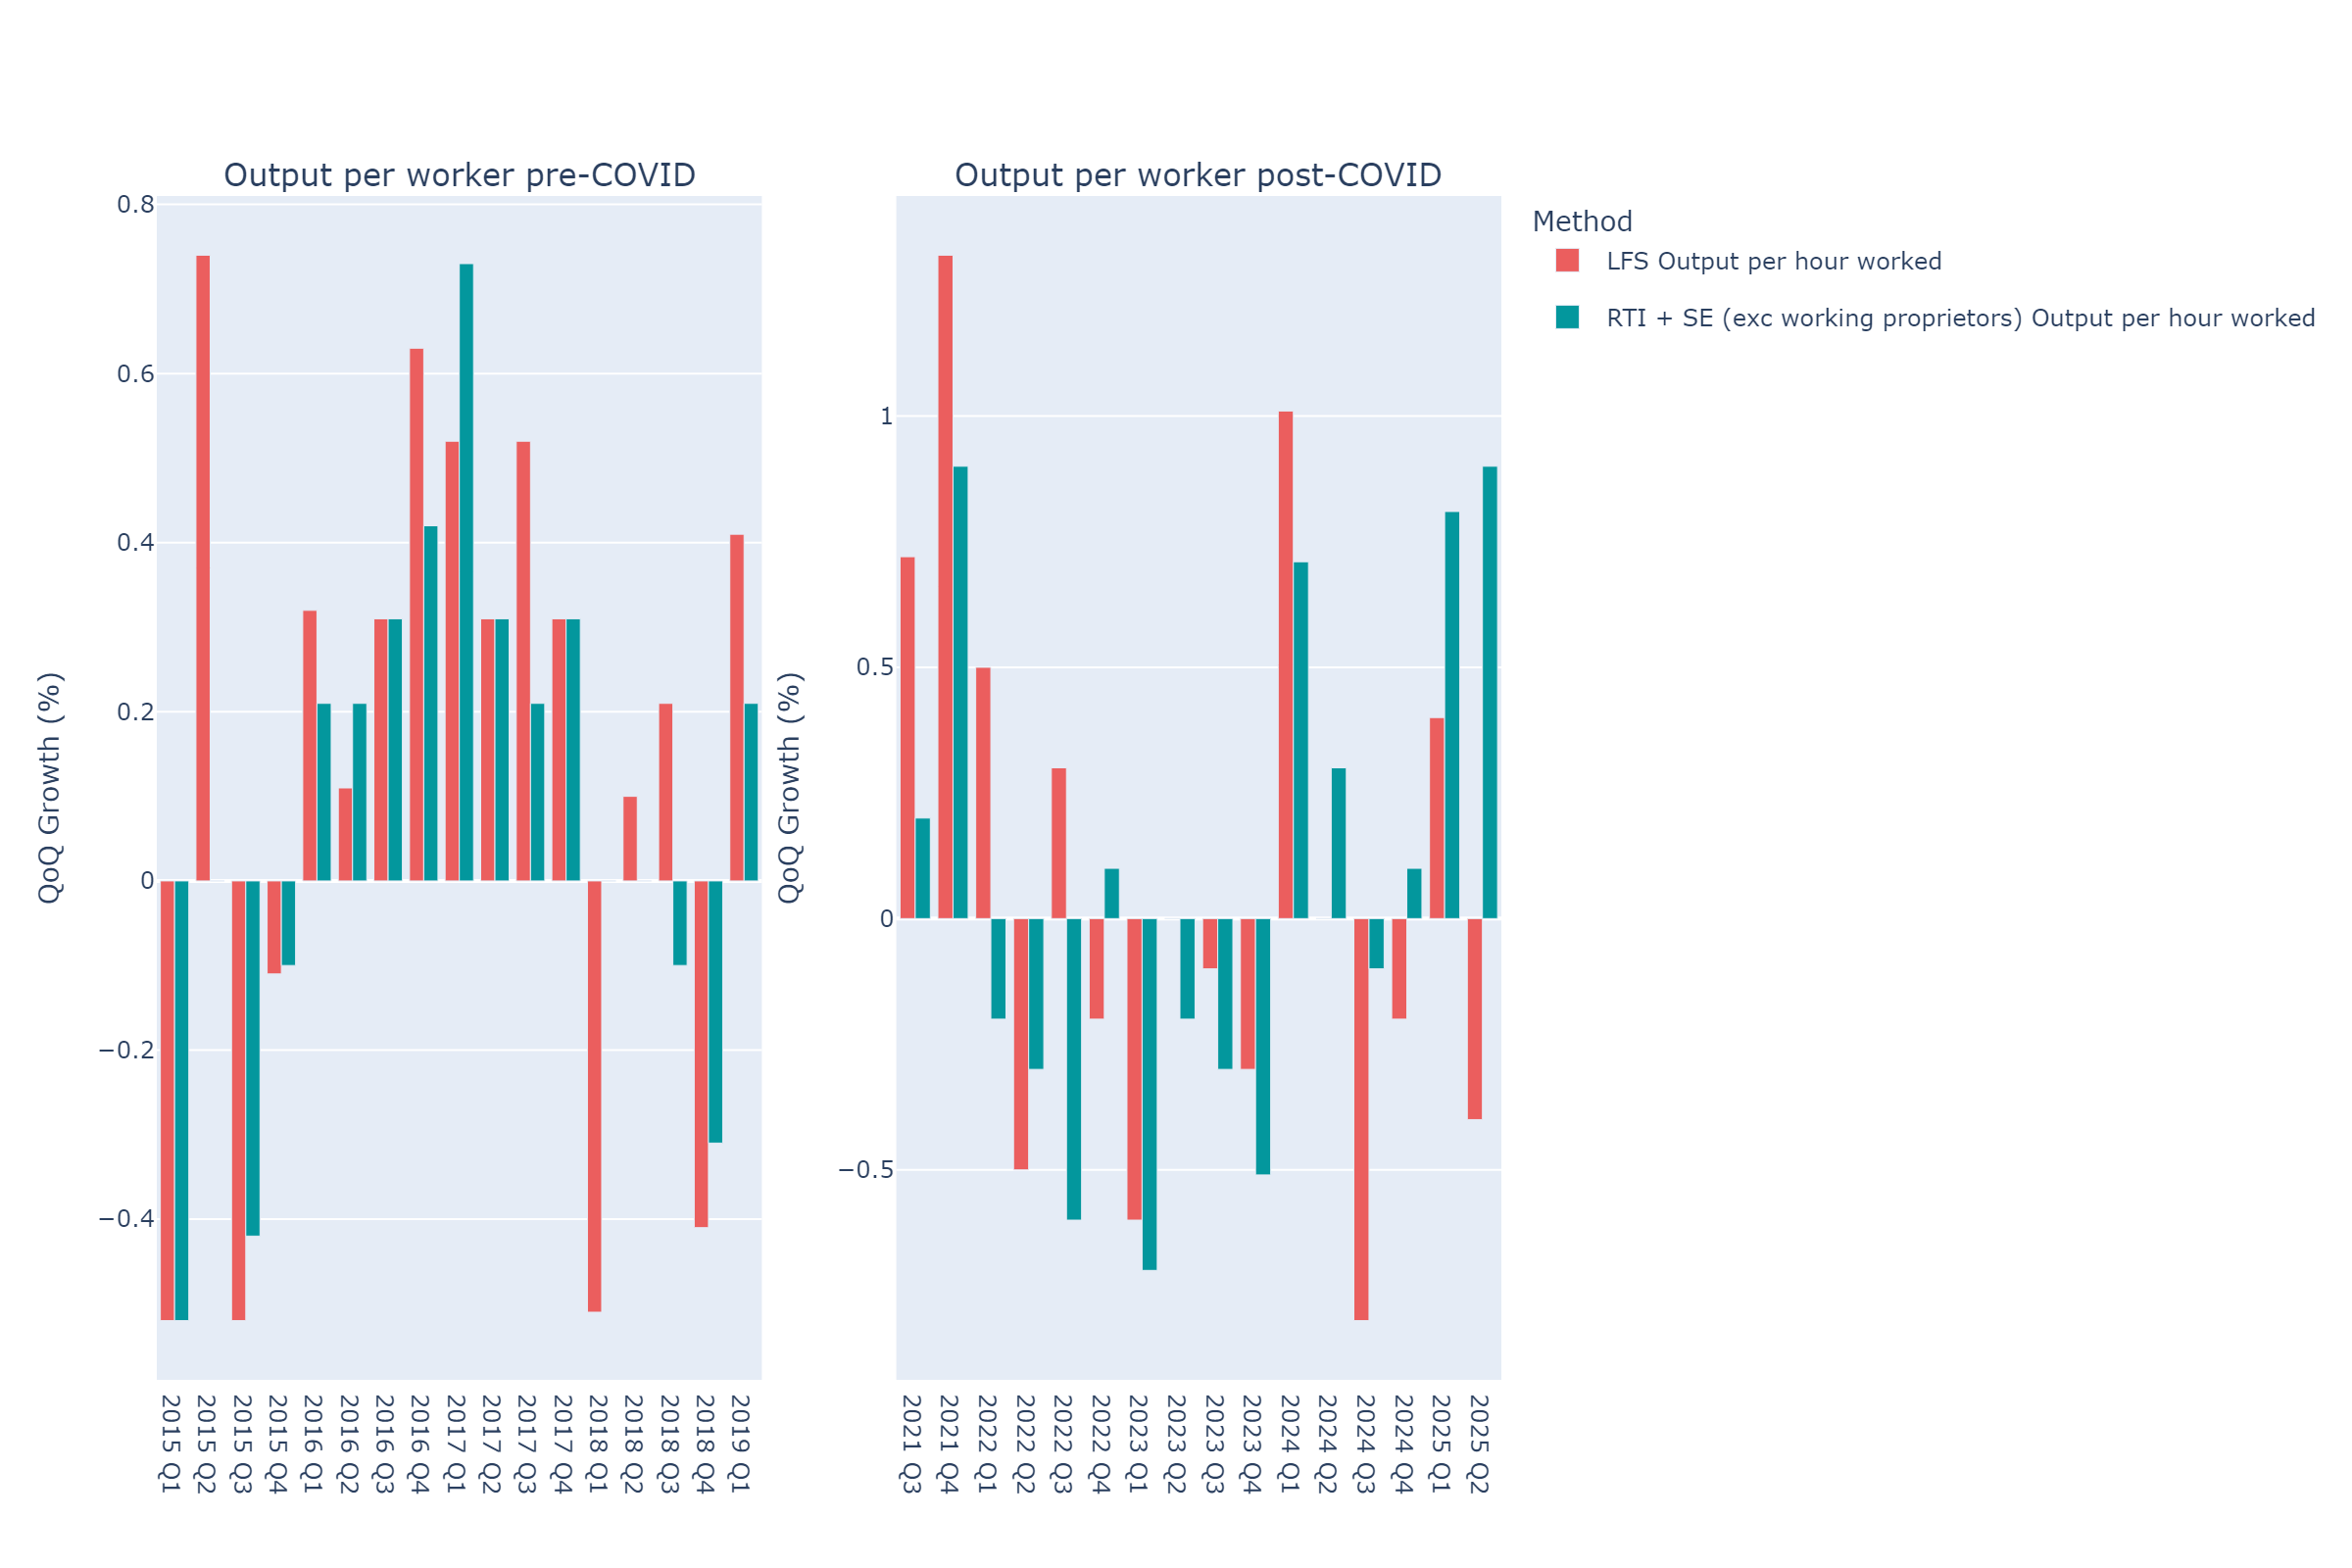
Figure 3: OPW calculated using LFS vs RTI + SE QoQ Growth (%) for Q1 2015 – Q1 2019 and Q3 2021 – Q2 2025. Data Source: Office for National Statistics, Own elaboration by TPI Productivity Lab
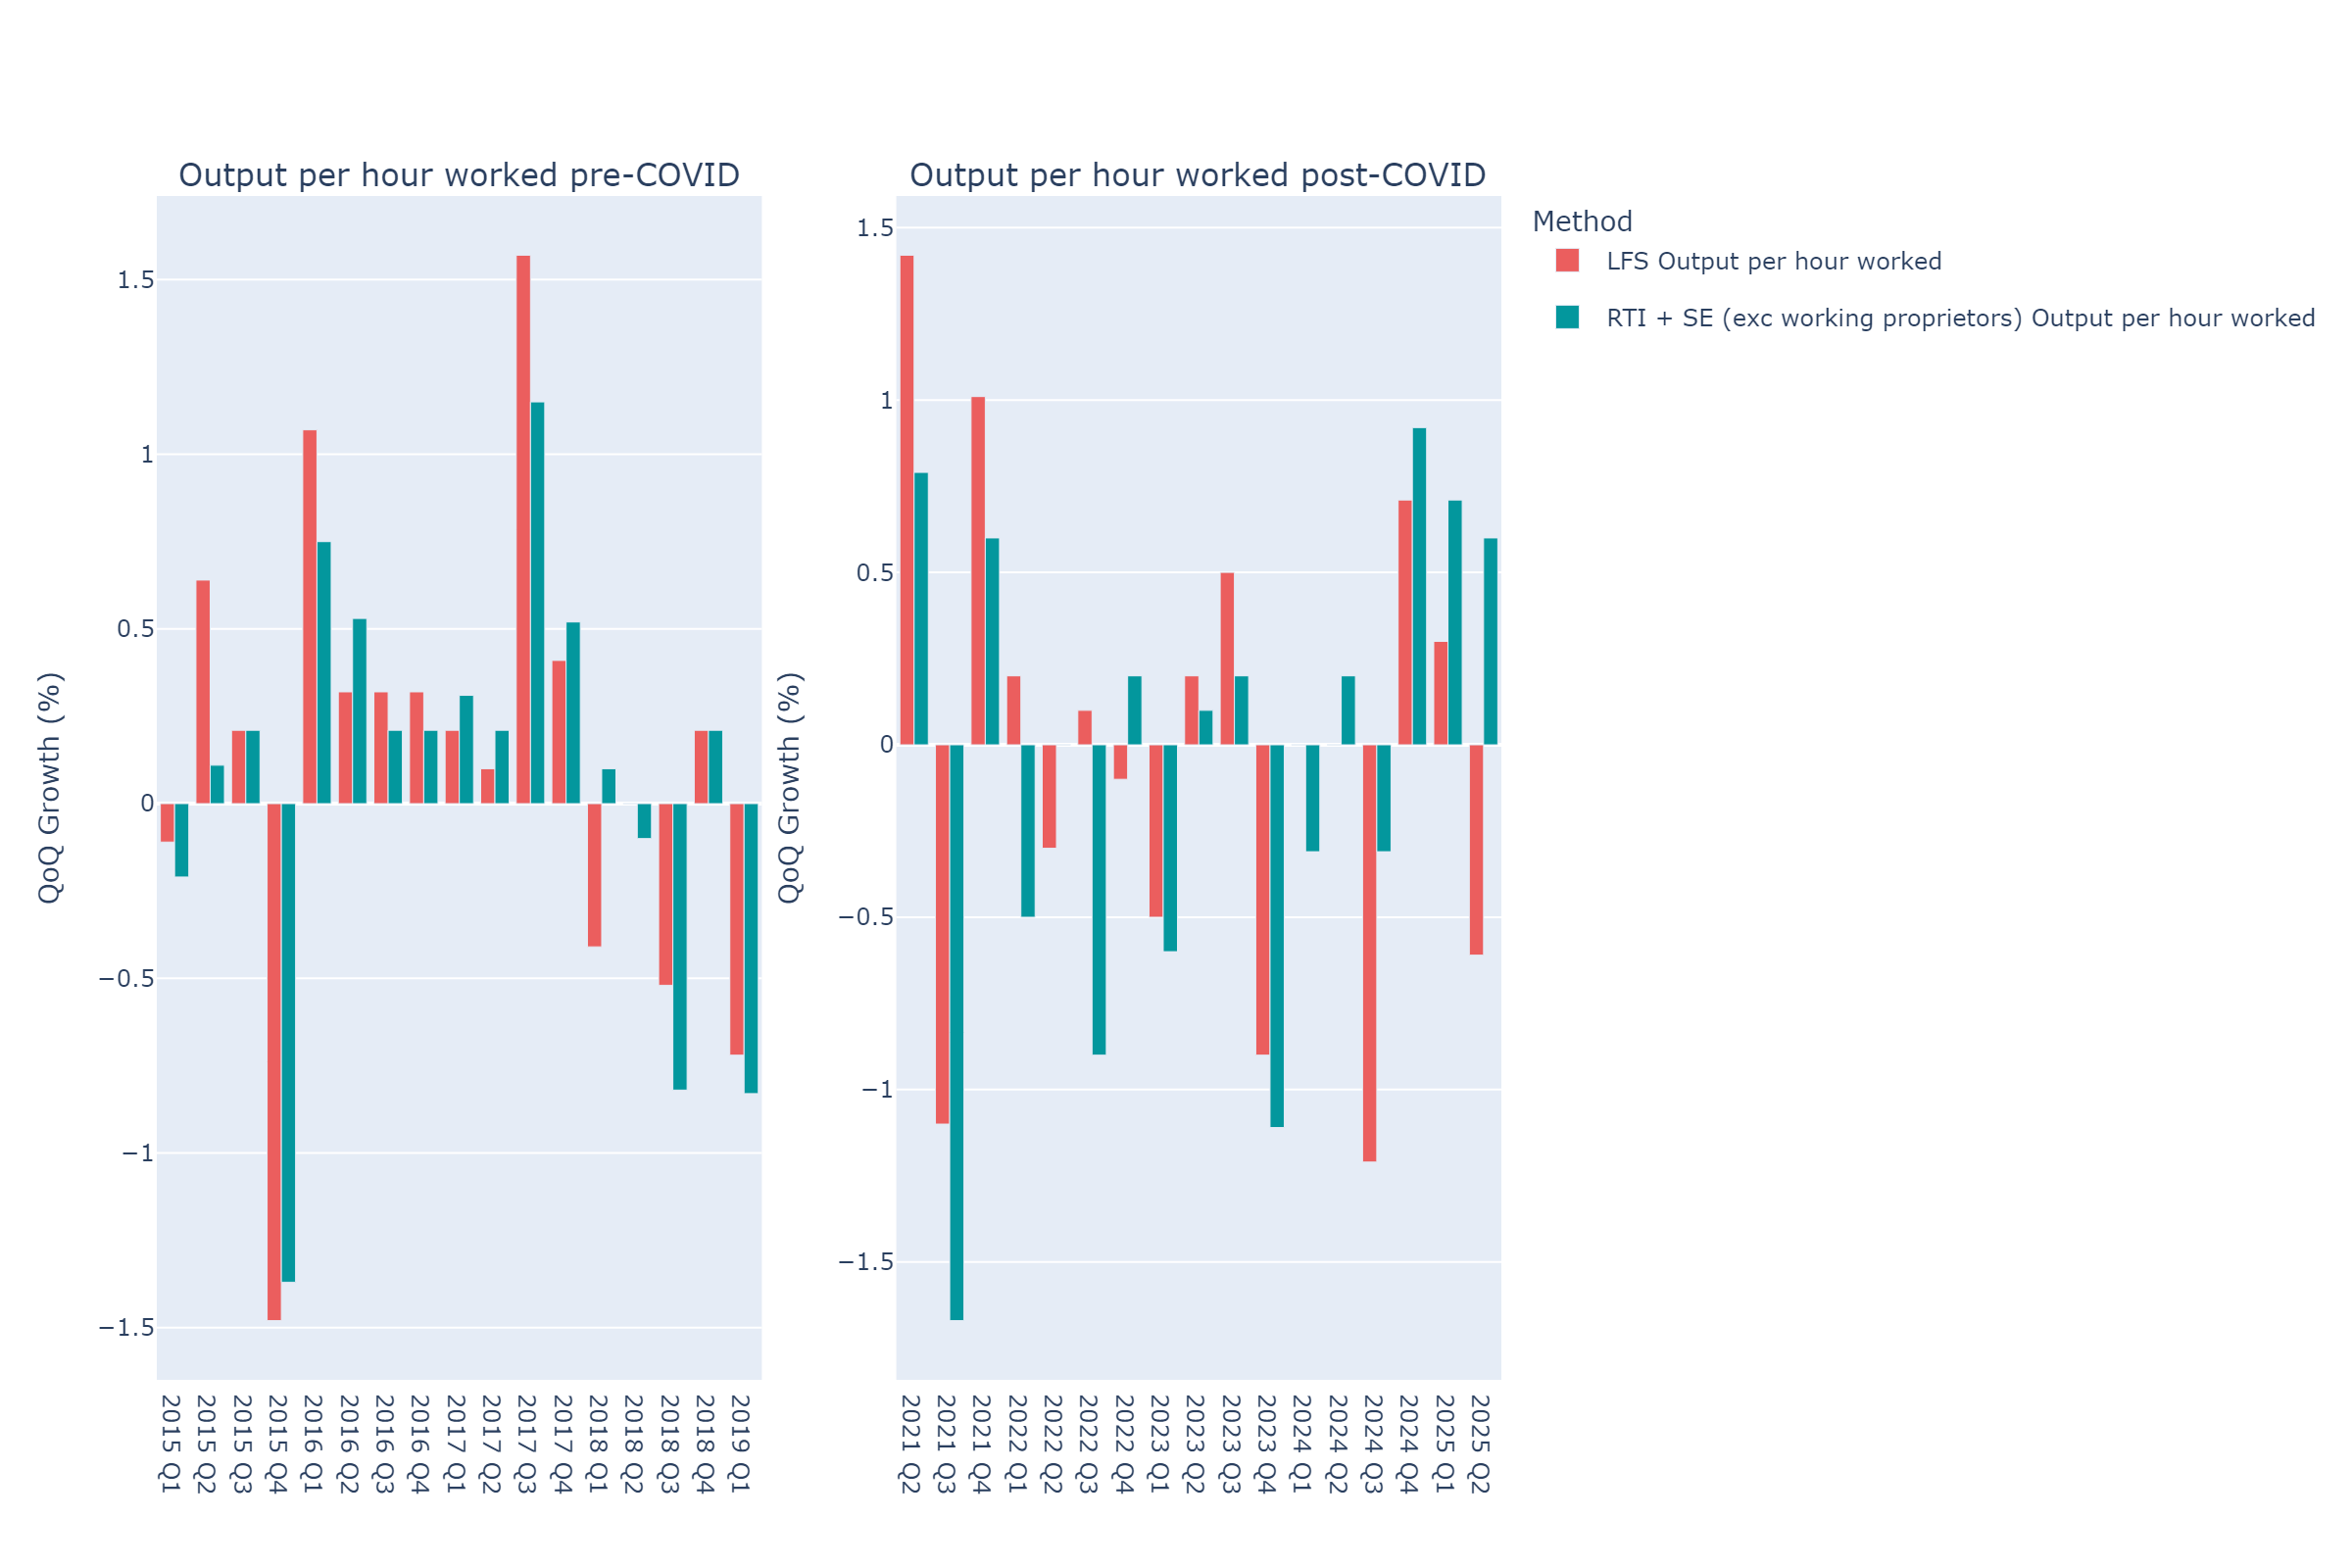
Figure 4: OPH calculated using LFS vs RTI + SE QoQ growth (%) for Q1 2015 – Q1 2019 and Q2 2021 – Q2 2025. Data Source: Office of National Statistics, Own elaboration by TPI Productivity Lab
Divergence in trend
The effect of the coronavirus pandemic on productivity was relatively short term, with the output per hour rebounding quickly and returning to its long-term trend by late 2021- unlike the sharp and prolonged decline observed during the 2008 recession. Figure 5, which illustrates the trajectory of output per hour, hours worked, and gross value added (GVA) from Q1 2007 highlights this trend. However, while the immediate post-pandemic recovery was strong, recent quarters have shown a deceleration in productivity gains and a modest divergence from the long-run trend, suggesting emerging challenges to sustained productivity growth.

Figure 5: Output per hour worked vs Hours worked vs Gross Value Added for Q2 2025 Flash Estimate data (Q1 2007 =100). Data Source: Office of National Statistics, Own elaboration by TPI Productivity Lab
International comparison
In Q2 2025, the UK recorded the weakest quarter-on-quarter performance among the major advanced economies. While the US and France registered expansions, Germany and Italy contracted, and the UK economy declined the most, marking it as the poorest performer of the group. The comparison between these nations is illustrated in Figure 6 below, which was created using the TPI Quarterly Data Tool. More information about the tool is linked on the Productivity Lab’s webpage.
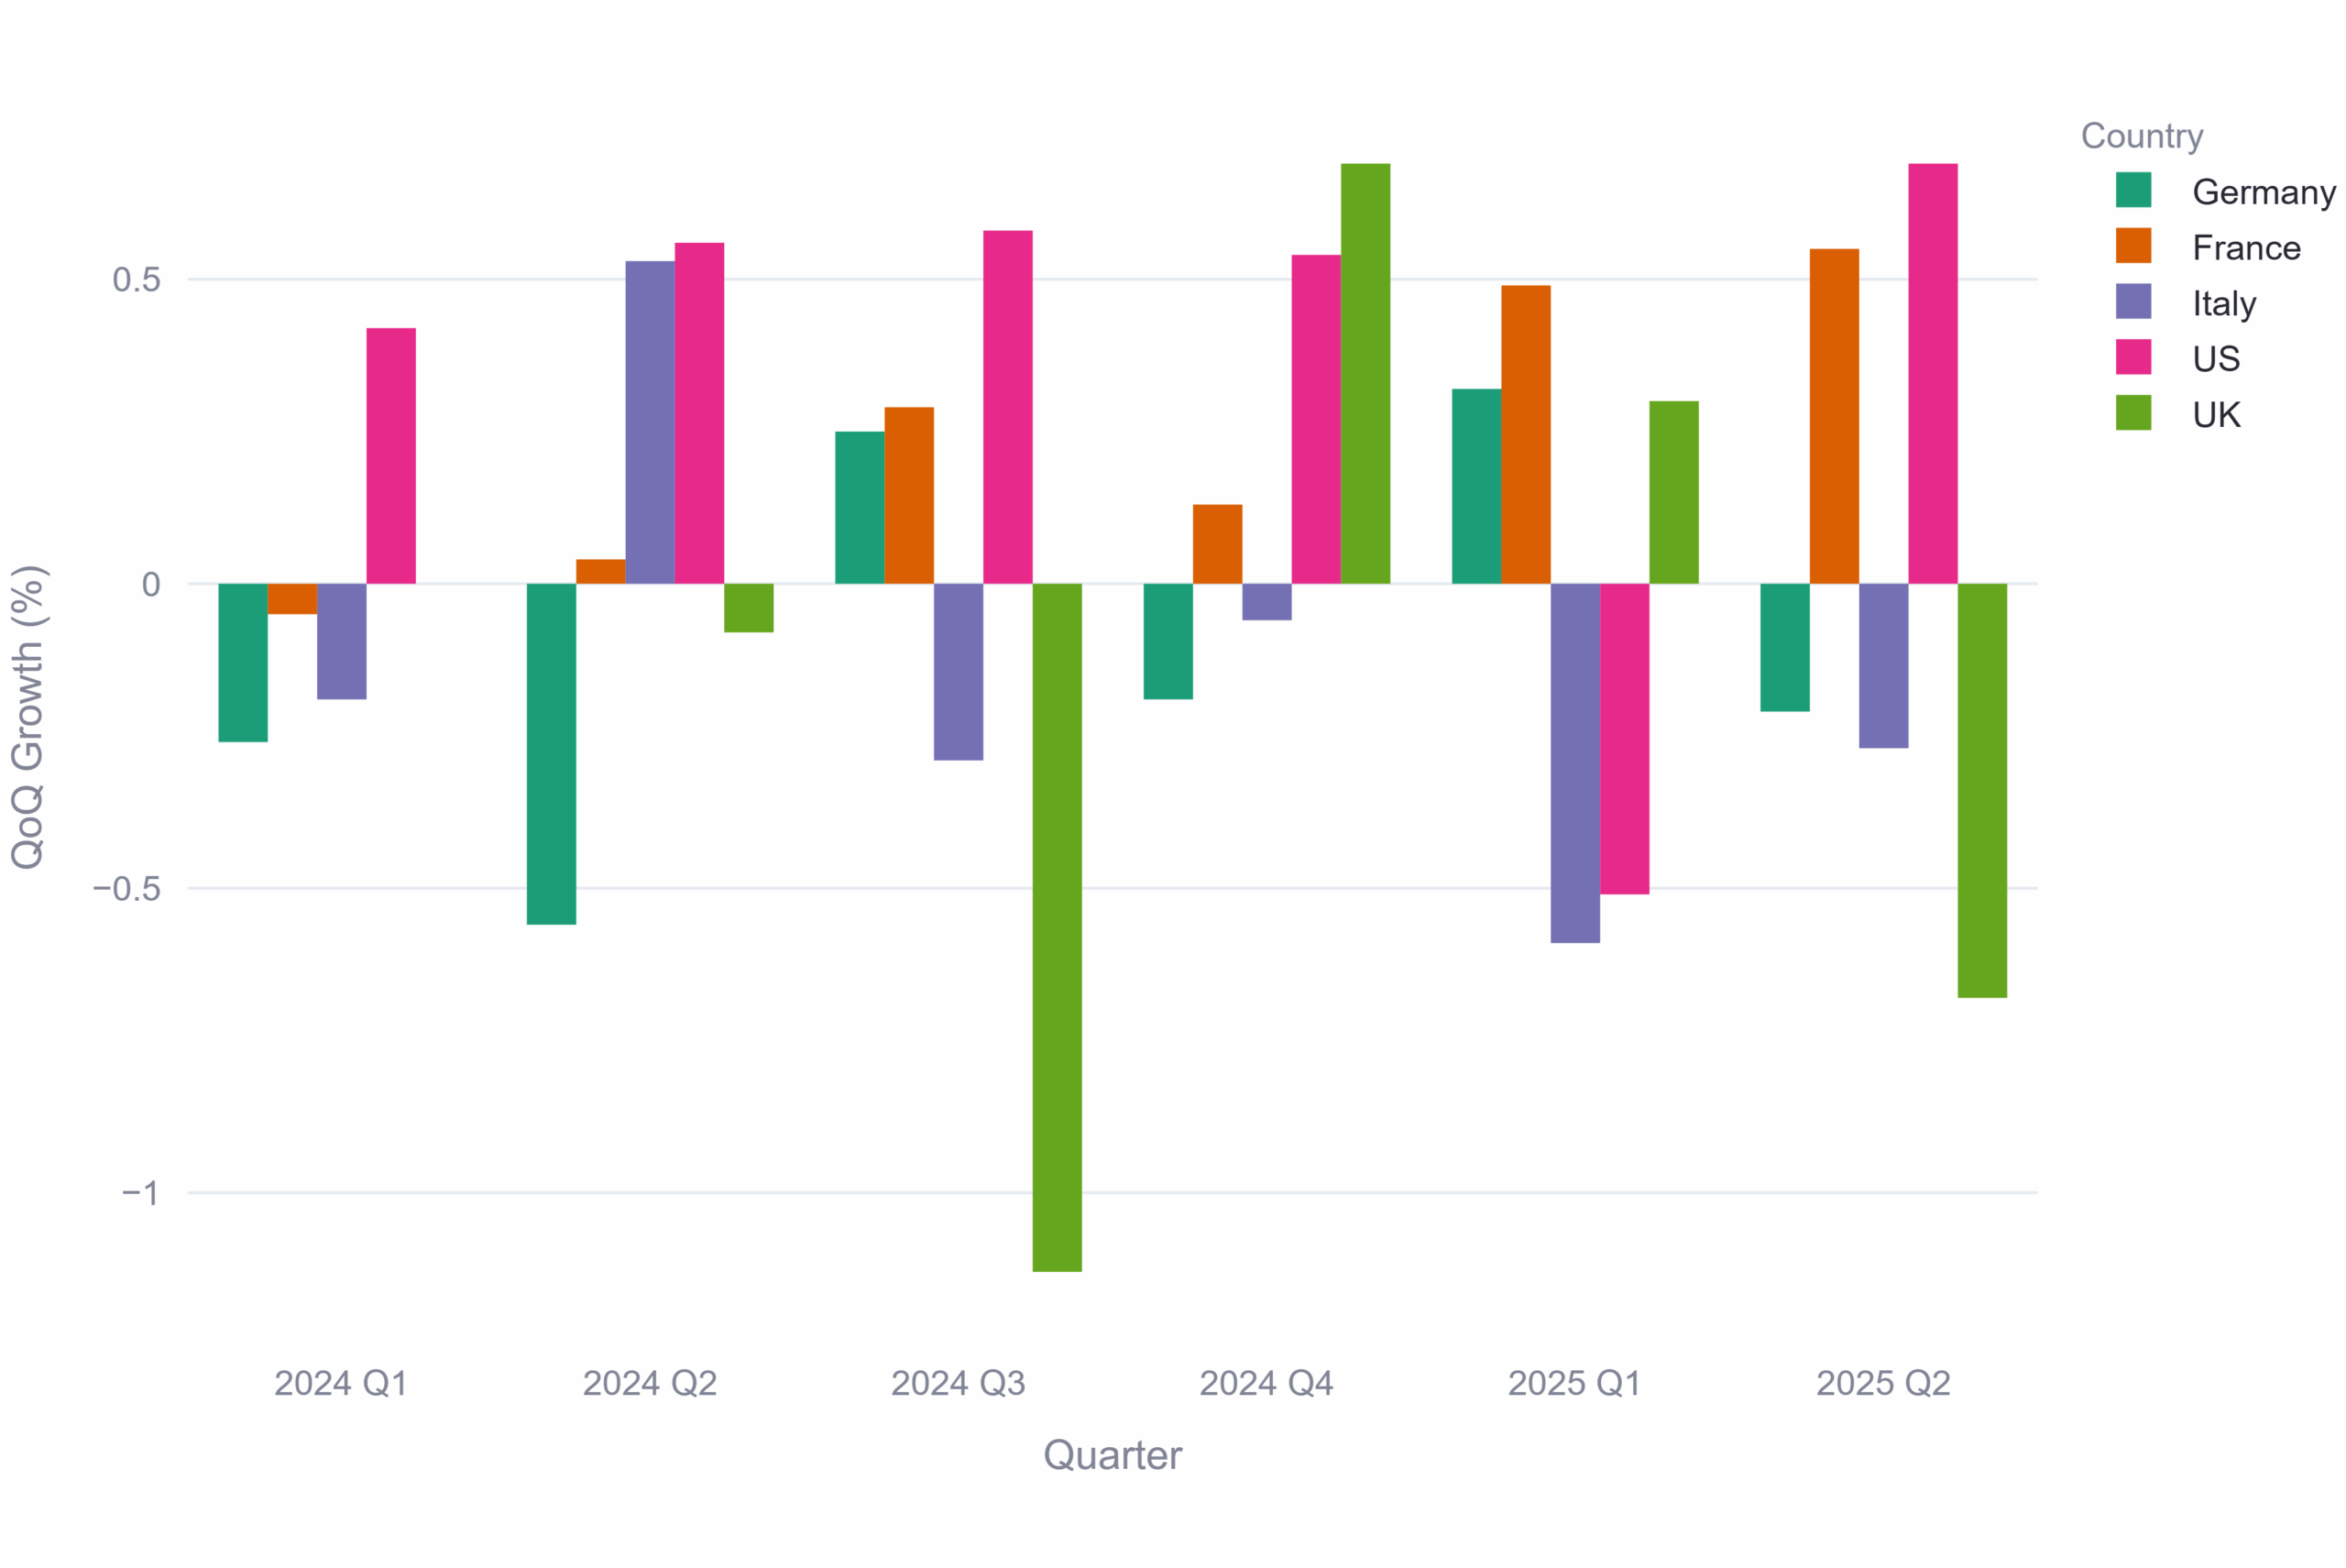
Figure 6: Quarter-on-quarter output per hour by Country. Data Source: ONS, Bureau of Labor Statistics, Eurostat, visualisation created using the TPI Quarterly Data Tool
Discussion
According to the Financial Times, the UK economy expanded by 0.3% in the second quarter of 2025. While this figure surpassed economist’s forecasts of 0.1%, it still points to a slowdown in momentum compared with the 0.7% growth recorded in the first quarter. The weaker performance has raised doubts about whether the UK will be able to sustain growth in the next quarter. OECD data shows that Britain ranked joint third with France amongst G7 nations in the second quarter, as shown in Figure 7.
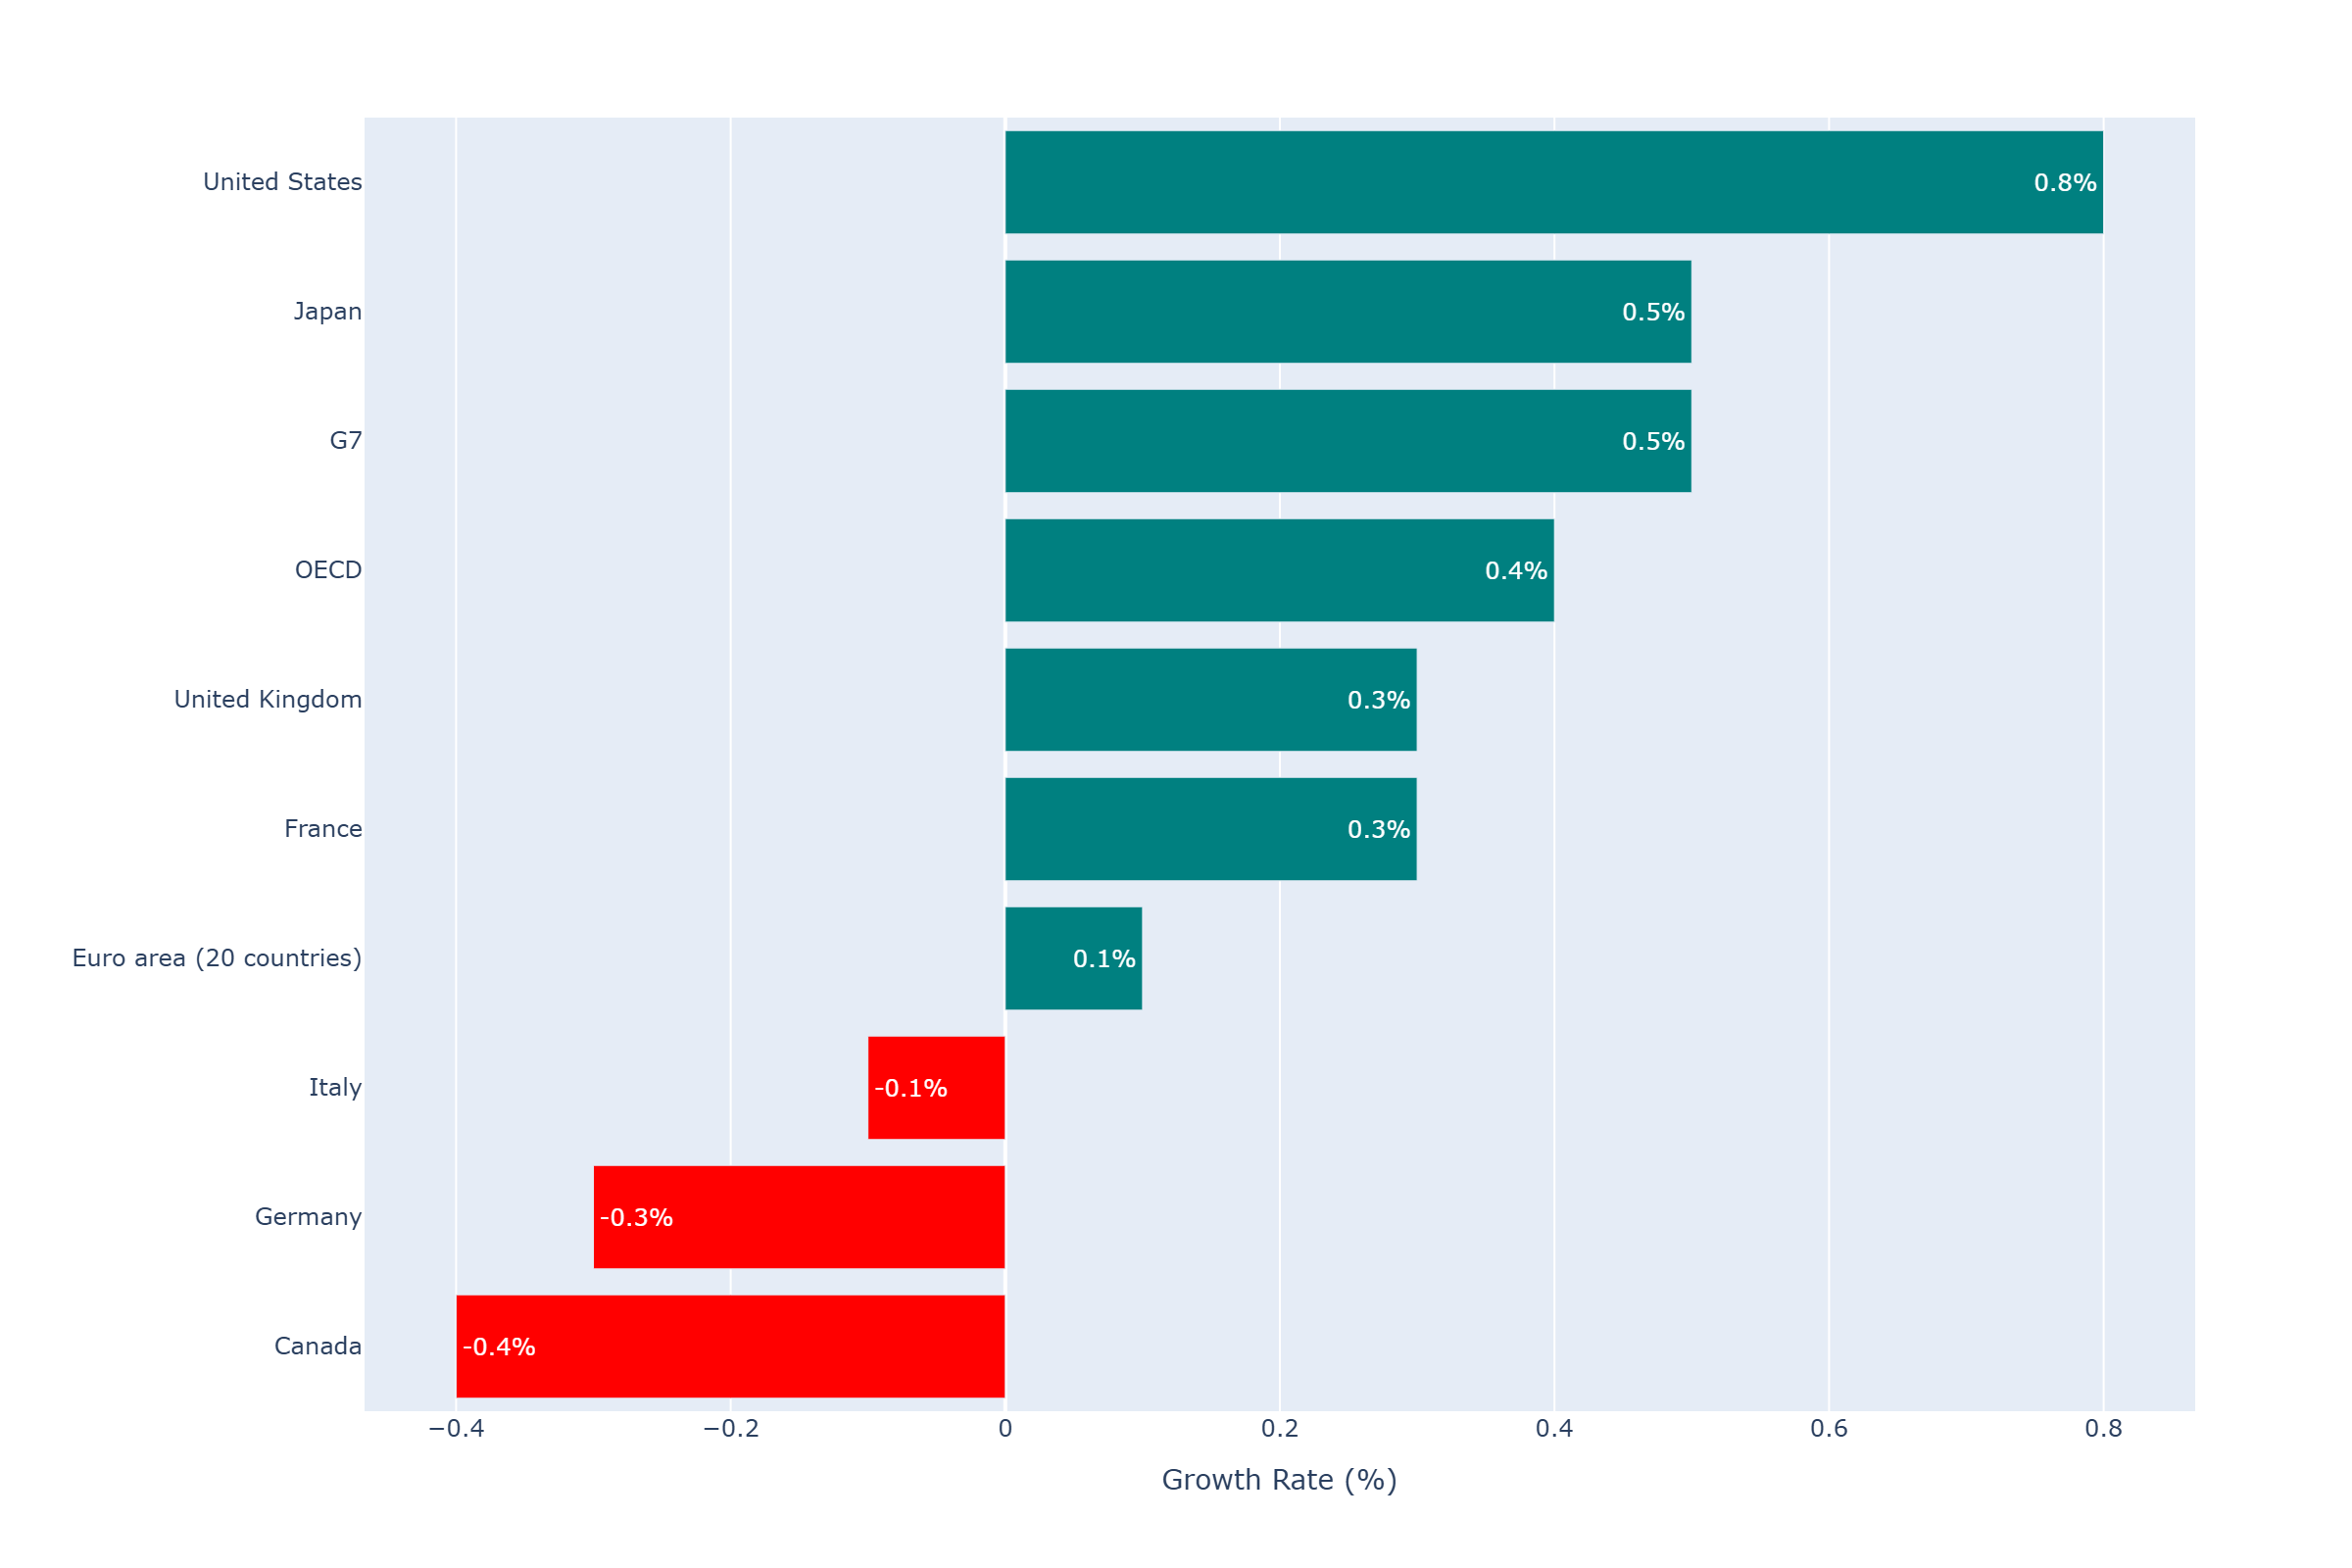
Figure 7: Q2 GDP Growth by Country. Data Source: OECD, Own elaboration by TPI Productivity Lab