Greening productivity measurement
This blog, written by Josh Martin (Bank of England, ESCoE) supports the release of TPI Working Paper ‘Environmentally-adjusted productivity measures for the UK‘, co-written by Matthew Agarwala, from the Bennett Institute for Public Policy at the University of Cambridge.
This year’s annual climate change conference, COP27, comes at a time of economic challenge in most developed economies – inflation is at highs not seen for decades, interest rates are rising for the first time in years, a recession is looming, and productivity growth remains persistently weak. These are, however, not the biggest challenge that faces us – the climate crisis is.
These twin challenges – economic and environmental – have in the past been pitted against each other. The “de-growth agenda” suggests that in order to tackle global warming, we must reduce economic growth. Some “growth agendas” would have us jeopardise environmental goals by renewing fossil fuel projects in the name of economic growth.
But are environmental action and economic growth substitutes, or complements? Could productivity growth drive both economic growth, and the Net Zero transition? Perhaps that depends on how you measure productivity, and economic output.
In a new TPI working paper, published today, we explore four measures of environmentally-adjusted productivity for the UK.
Consider Chart 1. This shows that UK real GDP grew around 75% between 1990 and 2019. Meanwhile, the amount of energy used in the economy fell about 20%, and greenhouse gas emissions fell about 40%. Even consumption-based accounting (which captures the possibility that domestic emissions are merely being off-shored) shows a similar, albeit smaller trend with a reduction of about 22% over the same period. Clearly economic growth can be achieved whilst reducing certain kinds of environmental damage.
The difference between the growth of GDP and the (inverse) growth of energy or emissions can be thought of as productivity measures. Productivity is how much output can be produced per unit of input, so in this case the “input” would be energy, or ‘the environment’ (where emissions can be thought of as ‘using up’ the environmental input).
Energy-productivity is then the growth in output less the growth in energy use, which is equivalent to the light green area in Chart 1. This has more than doubled since 1990.
Emissions-productivity is the growth in output less the growth in emissions, which is the darker green area plus the light green area in Chart 1. Since most emissions come from energy use, we can think about the gains in emissions-productivity being mostly from the gains in energy-productivity, but with additional gains from ‘greening’ the sorts of energy we use (moving from fossil fuels to renewables, for instance).
However, the growth in energy-productivity and emissions-productivity could be just because of the changing industrial composition of the UK economy. Perhaps the transition from manufacturing to services industries is driving this change? Using detailed industry data from ONS, we can now answer this question. In fact, compositional changes account for only around 10-20% of the growth in aggregate energy-productivity and emissions-productivity, with the rest coming from improvements within industries.
Chart 1: Real GDP has grown over the past 30 years, while energy use has fallen and greenhouse gas emissions fallen even further
Real GDP, energy use and greenhouse gas emissions, 1990 to 2019, index 1990 = 100
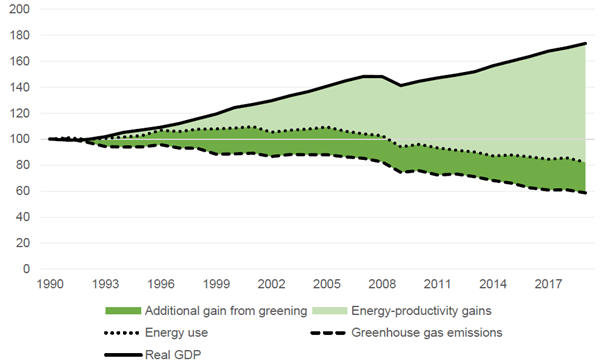
Notes: Real GDP excludes imputed rental, consistent with measures used throughout the paper; it will therefore not match headline UK GDP.
Our new paper documents these trends for 42 detailed industries, with interesting results. For instance, the waste management industry has seen big improvements in emissions-productivity, likely associated with increased recycling and the use of greener waste collection vehicles. Meanwhile the road transport industry (hauliers, taxis, bus transport, etc.) has seen little growth in energy-productivity, and the postal and courier industry has seen a decline.
What about accounting for the environment in GDP?
A different way of thinking about environmentally-adjusted productivity is not to change the inputs, but to change the output. Starting from a standard labour productivity measure (output per hour worked), how can we account for the environment in the output measure (GDP)?
One way is to treat the negative environmental side effects of production as a ‘bad output’ and subtract it from Gross Value Added (GVA). This is, in the jargon, internalising the negative externalities from greenhouse gas emissions and other pollutants. To do this, we estimate the cost of the emissions and pollutants, by multiplying the amount of emissions (e.g. 1000 tonnes of carbon dioxide) by a price (e.g. £273 per tonne). We then subtract this from ‘standard’ GVA to get an environmentally-adjusted GVA measure, or what we call “GVA-minus”.
We do this for all the greenhouse gases under the Kyoto Protocol, and a range of other pollutants, and we do so for 39 industries, using detailed data from ONS. In some industries, the ‘bad outputs’ are so large that they outweigh the ‘standard’ output measure, such that GVA-minus is negative. That’s true for the petroleum manufacturing and air transport industries, amongst others.
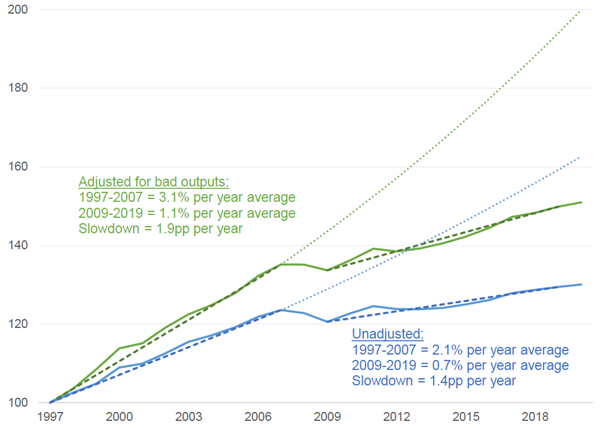
Since emissions have been declining, their negative effect on GVA-minus falls over time, and so GVA-minus grows faster than ‘standard’ GVA. That means labour productivity with bad outputs (GVA-minus per hour worked) grows faster than standard labour productivity, as Chart 2 shows. However, this faster growth occurs both before and after the financial crisis, so it does not make the productivity slowdown any less.
Our new paper shows the result of this adjustment for 39 industries, with much larger effects in some industries than others. Manufacturing (especially heavy manufacturing) benefits a lot, while services sees little improvement.
Chart 2: Adjusting for ‘bad outputs’ increases the rate of UK labour productivity growth, but does not close the “productivity puzzle”
Whole economy labour productivity, with and without adjustment for bad outputs, with pre-downturn trends, 1997 to 2020
Notes: Pre-downturn trend calculated as the compound average annual growth rate from 1997 to 2007. Projection assumes this rate of growth continues from 2007 onwards.
A final measure treats expenditure by businesses on environmental protection activities as investment, rather than just cost, and adjusts GVA up to account for this (what we call “GVA-plus”). This raises the level of GVA, and hence productivity, but has little effect on the growth rate.
While there is a lot more to be done to develop these measures, we hope they offer insights into the opportunities for productivity growth to support the Net Zero transition, and an opportunity to reflect on the way our economic statistics help us understand the important economic and environmental challenges facing us today. Ultimately, our results constitute a rare ‘good news story’ in environmental economics: the UK is using energy more productively than ever, reducing the emissions intensity of GDP, and most importantly, there is significant room for further improvement across many industries.
The views expressed here are those of the authors, and should not be taken as the views of the Bank of England or any of its committees.


